Your business in 360°
HubSpot and Power BI Integration: Methods, API and Refresh

There are two ways to connect HubSpot to Power BI. The first is a ready-made connector that moves your CRM data into Power BI for you. The second is integration through the HubSpot API, where you pull the data yourself using Power Query or an intermediate database. A connector gets you up and running faster. The API gives you precise control over which objects, fields and history end up in your reports. You get the most value when HubSpot sales data meets accounting data from Rivilė or Finvalda in a single Power BI model. This guide covers both routes, a preparation checklist, the API steps, refresh settings and the most common errors.
In brief
- Two routes: a ready-made connector (quick to launch) or the HubSpot API (full control, but needs maintenance).
- One direction: data flows from HubSpot to Power BI. Power BI itself does not change records in HubSpot.
- API work: you need an access token with read permissions and queries that read every page of results.
- Refresh: a report is only up to date when scheduled refresh and credentials are set up in the Power BI service.
- Greatest value: HubSpot deals alongside actual revenue, outstanding balances and profit from your accounting software.
Contents
- Why connect HubSpot and Power BI
- Connector or API: the differences
- What you need before you start
- HubSpot API and Power BI: step by step
- How to keep your reports up to date
- Common problems and solutions
- Our view
- HubSpot and accounting data in one model
- FAQ
- Sources
Why connect HubSpot and Power BI
HubSpot is good at showing what is happening in the sales pipeline. But a manager usually needs the answer to a different question: how many of those deals turned into invoices, payments and profit. That data lives in the accounting software, not in the CRM.
Power BI brings both worlds together. The HubSpot objects most often analysed are:
- Deals: stages, amounts, probabilities, account owners, close dates.
- Companies and contacts: segments, sources, regions, lifecycle stages.
- Activities: calls, meetings, emails, tasks.
- Marketing metrics: campaigns, forms, conversions to leads.
Once you connect accounting data to these, metrics appear that you will never see in the CRM alone: sales forecast accuracy, time from deal won to payment, and customer profitability by segment. We have written more about forecasting in our guide to sales forecasting with Power BI, and about grouping customers in our article on B2B customer segmentation.
Connector or API: the differences
According to an overview of HubSpot and Power BI integration methods, a ready-made connector synchronises data automatically and handles the complexity of the API itself, whereas API integration offers the most control but requires programming and ongoing maintenance. The same source stresses that the data flow is one-way: from HubSpot to Power BI.
| Criterion | Ready-made connector | HubSpot API integration |
|---|---|---|
| Speed of launch | Fast, often no code | Queries and a model need to be built |
| Data scope | Whatever the connector developer provides | Any object and field the API allows |
| Custom fields | Depends on the connector’s capabilities | Fully under your control |
| Maintenance | Handled by the connector vendor | Your team or a partner |
| Cost | A separate connector subscription | Development and maintenance time |
| Combining with accounting | Requires additional modelling | Designed into a single model from the outset |
When choosing, answer three questions: how many custom fields you use in HubSpot, whether your reports will need historical stage changes, and whether CRM data will be combined with Rivilė or Finvalda data. The more times you answer “yes”, the stronger the case for the API and a single shared Power BI model.
What you need before you start
Preparation saves the most time. Before building your first query, get the following in place:
- Access to HubSpot: administrator rights so that you can create an access token and grant the necessary permissions.
- Power BI licences: Power BI Desktop to build the report, and a Pro or Premium licence for publishing and sharing.
- A list of metrics: the 5–10 questions the report needs to answer. Without one, the model bloats with unnecessary fields.
- A field map: which HubSpot fields are standard and which were created by your company, and what your deal stages and pipelines are called.
- A key for joining to accounting: usually the company registration number or VAT number, recorded both on the HubSpot company record and in the accounting software.
- Data quality rules: duplicates, blank fields and inconsistent names will spoil even the best model. A data quality monitoring checklist is useful here.
HubSpot API and Power BI: step by step
Below is the typical route when data is pulled directly into Power BI through Power Query.
1. Create an access token
In the HubSpot settings, create an integration app and its access token. Grant read-only permissions only for the objects your reports need: deals, companies, contacts. Treat the token like a password and never put it in shared files.
2. Write your first query in Power Query
In Power BI Desktop, choose a blank query and use the Web.Contents function. The access token is passed in the Authorization header with the word Bearer. Write the base URL and the path separately, using the RelativePath parameter, and pass filters through Query. This matters for refreshing later in the Power BI service.
3. Read all the pages
The HubSpot API returns results in batches. Each response contains a pointer to the next page (the after cursor), which has to be passed to the next request. In Power Query, the List.Generate function is used for this: it repeats the requests until the response no longer contains a cursor. If you skip this step, your report will show only the first batch of records and you will not even notice.
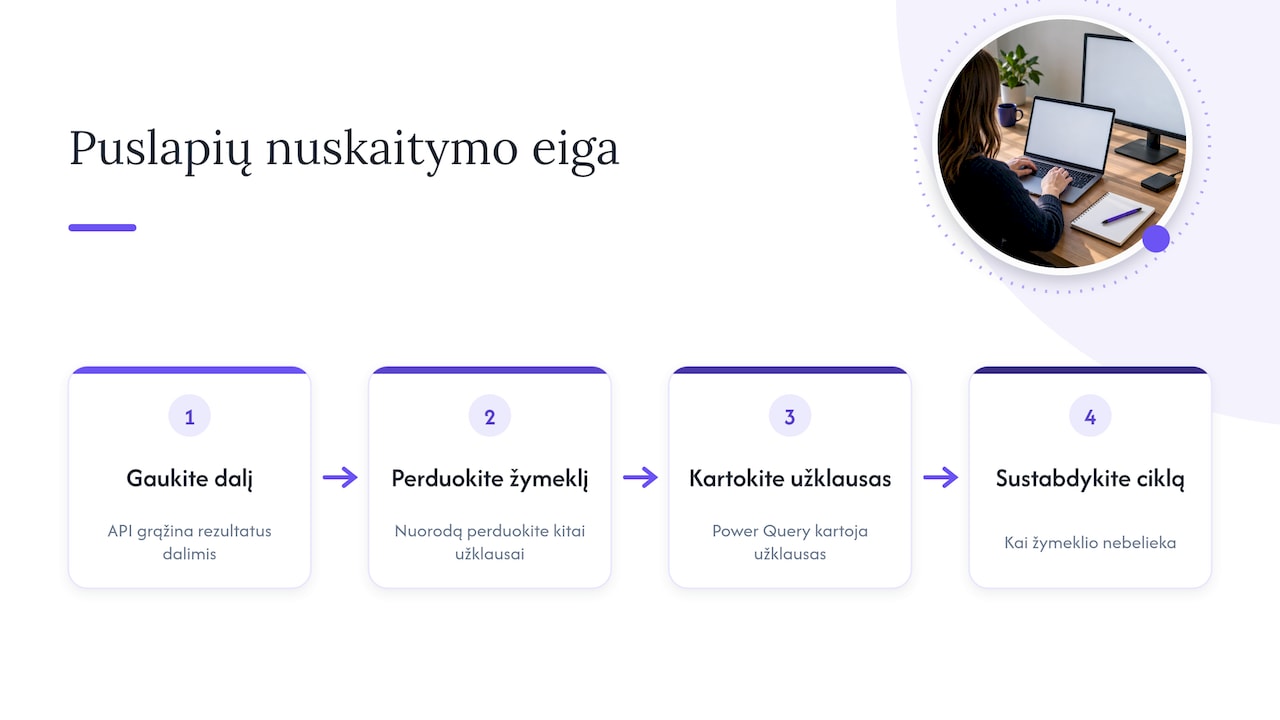
4. Request the fields you need
By default, the API returns only some of the properties. In your query, specify every field you need: amount, stage, pipeline, close date, owner. Use separate queries to read the lists of deal stages and users, so that the report shows names rather than IDs.
5. Model the data
Build a star schema: a fact table of deals, with dimensions for companies, account managers, stages and a calendar. You get the links between deals and companies through API associations. This is also where you connect the accounting data via the shared company registration number.
6. Publish and set up refresh
Publish the report to the Power BI service, enter the credentials in the semantic model settings and switch on scheduled refresh. More on this in the next section.
How to keep your reports up to date
HubSpot is a cloud service, so a data gateway is not normally needed to refresh its data. You need one when the same model contains on-premises sources, such as a Rivilė or Finvalda database on the company server or Excel files on a computer. We explained how it works in our article on the Power BI data gateway.
A few practical tips:
- Refresh frequency depends on your licence. Pro and Premium have different limits; we covered these and the settings in our guide to Power BI scheduled refresh.
- Match the timing to the rhythm of the business. A sales team usually needs no more than a morning refresh before the meeting and another after lunch.
- Use incremental loading. Rather than pulling the full history every time, filter by last modified date. The refresh takes less time and puts less load on the API.
- Turn on failure notifications. The Power BI service can email you when a refresh fails. That way you spot the error before your manager does.
Common problems and solutions
- The Power BI service will not allow the data source to be refreshed. The most common cause: the entire URL in the
Web.Contentsfunction is built dynamically. Solution: a static base URL, with the variable parts passed throughRelativePathandQuery. - Records are missing. The query reads only the first page. Check the pagination logic and compare the record count with the HubSpot list.
- A too-many-requests error. The API limits the number of requests per unit of time. Cut down the number of requests, ask only for the fields you need and use incremental loading.
- An access error after a while. The token’s permissions have changed or the token has been replaced. Update the credentials in the semantic model settings.
- Stages appear as numbers. The pipeline and stage lookup has not been loaded. Add a separate query and a relationship in the model.
- Amounts do not match the accounts. The CRM shows the deal value; accounting shows the invoice issued. These are different metrics: show them side by side in the report and label them clearly.
Our view
We find that HubSpot integration only becomes genuinely valuable once CRM data no longer sits in a separate report. The sales pipeline answers the question of what might happen. The accounts answer what actually did happen. A manager needs both on one screen.
That is why we design a single Power BI model in which HubSpot deals meet revenue, costs, outstanding balances and profit from Rivilė or Finvalda, along with SharePoint or Excel data where needed. The reports refresh automatically, with no extra work from users, so the team stops exporting spreadsheets and hunting for the version with the right numbers.
We tailor bespoke solutions to each company’s processes and existing IT systems. That way the integration reflects your sales stages rather than a generic template.
Analitika360
HubSpot and accounting data in one model
Analitika360 builds Power BI reports that combine Rivilė and Finvalda data with other sources, including CRM, SharePoint and Excel. If you use HubSpot, we can design the integration as a bespoke project: from the field map and API queries through to the model, automatic refresh and the management dashboard.
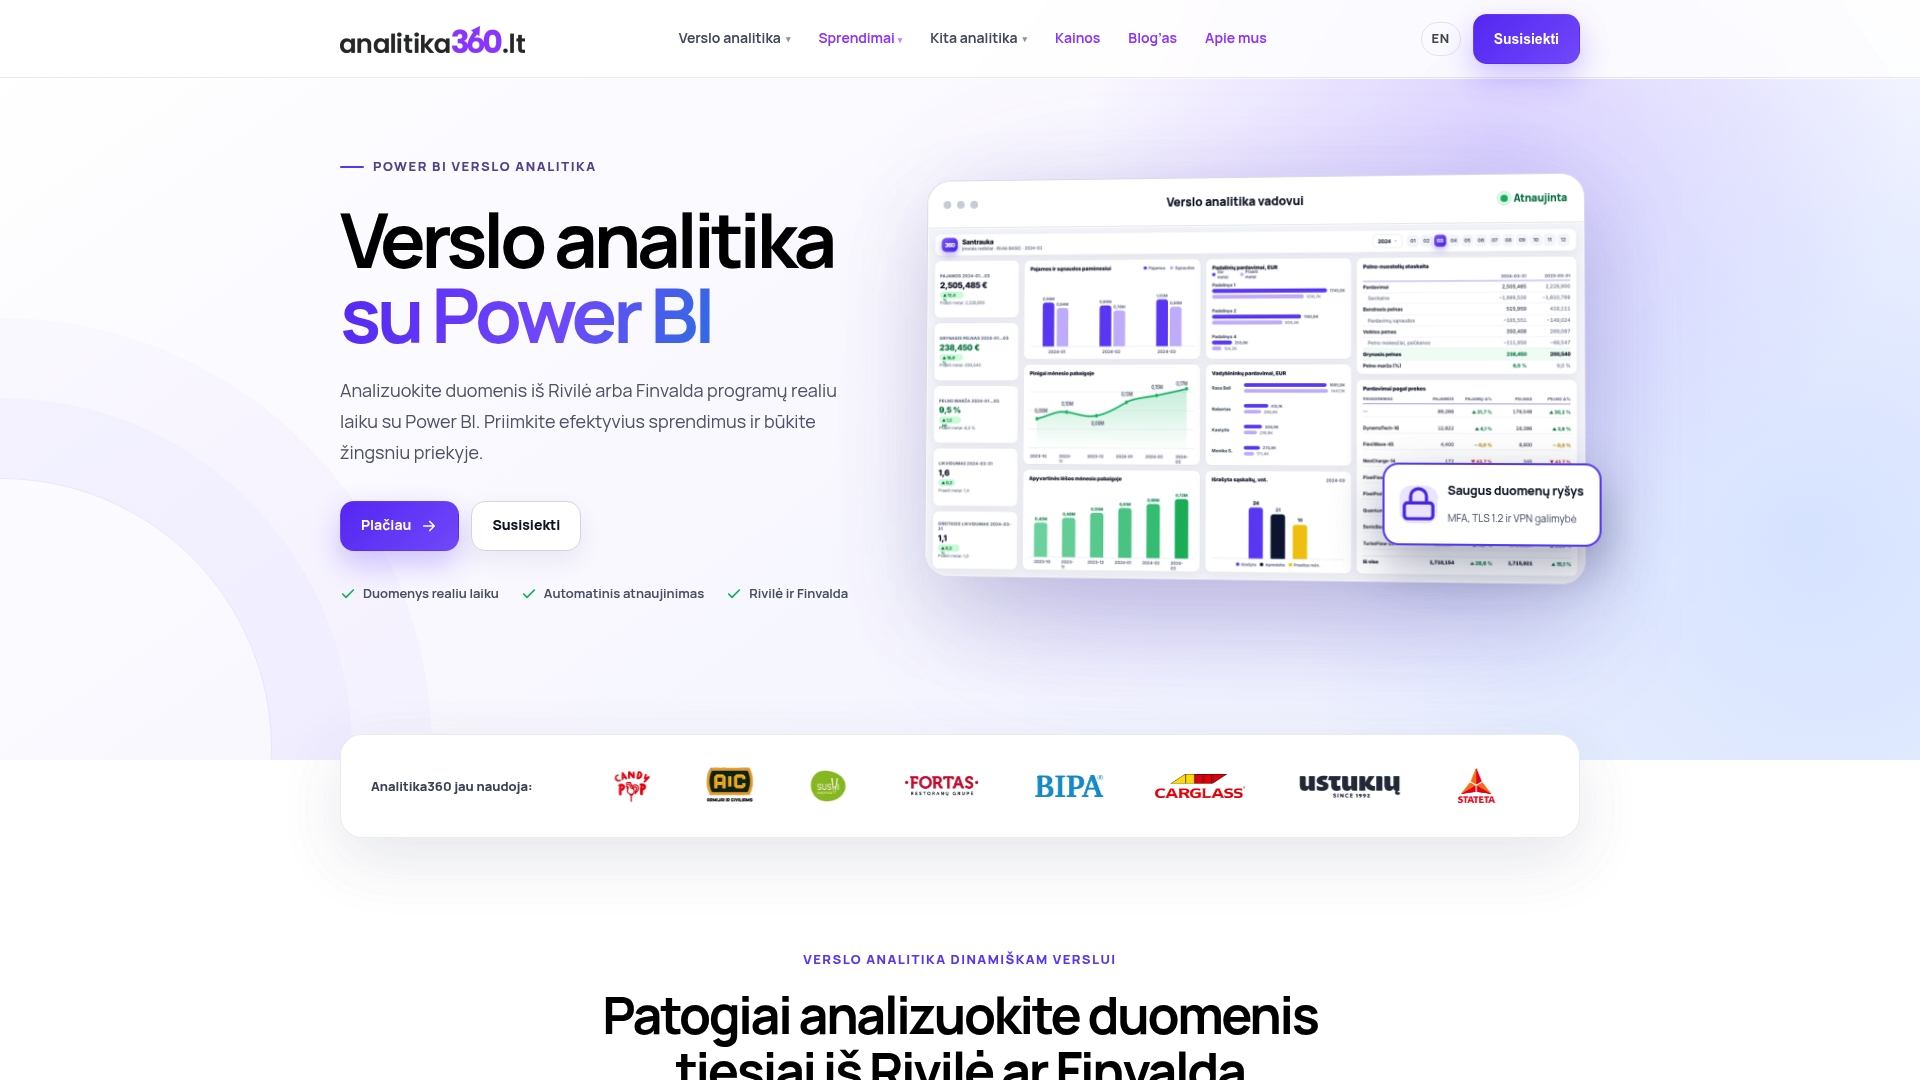
Bespoke projects cost €70 an hour. Accounting report packages range from €59 a month (Rivilė Basic and Finvalda Basic) to €89 a month (Rivilė PRO and Finvalda PRO). We can also arrange Microsoft Pro and Premium licences. You will find the full terms on our business analytics pricing page, and more on CRM data analytics in the article CRM and Power BI integration.
FAQ
Does HubSpot have an official Power BI connector?
Power BI has no standard HubSpot connector that you can select in the way you would Excel or SQL Server. So third-party connectors or integration through the HubSpot API are used instead. When CRM data needs to be combined with accounting data, the API and a single shared model are usually the most convenient option.
Can Power BI change data in HubSpot?
No. The integration is one-way: data flows from HubSpot to Power BI for analysis and visualisation. Records are changed in HubSpot itself.
How often does HubSpot data refresh in a Power BI report?
As often as you set scheduled refresh in the Power BI service, within the limits of your licence. For most sales teams, a few refreshes per working day are enough.
Can HubSpot data be combined with Rivilė or Finvalda data?
Yes. You need a shared key, usually the company registration number, recorded in both systems. You will then see deals, invoices, payments and profit by customer in a single model.