See more. Decide better.
 Balance Sheet in Power BI: Multi-Year Comparison with Drill-Down

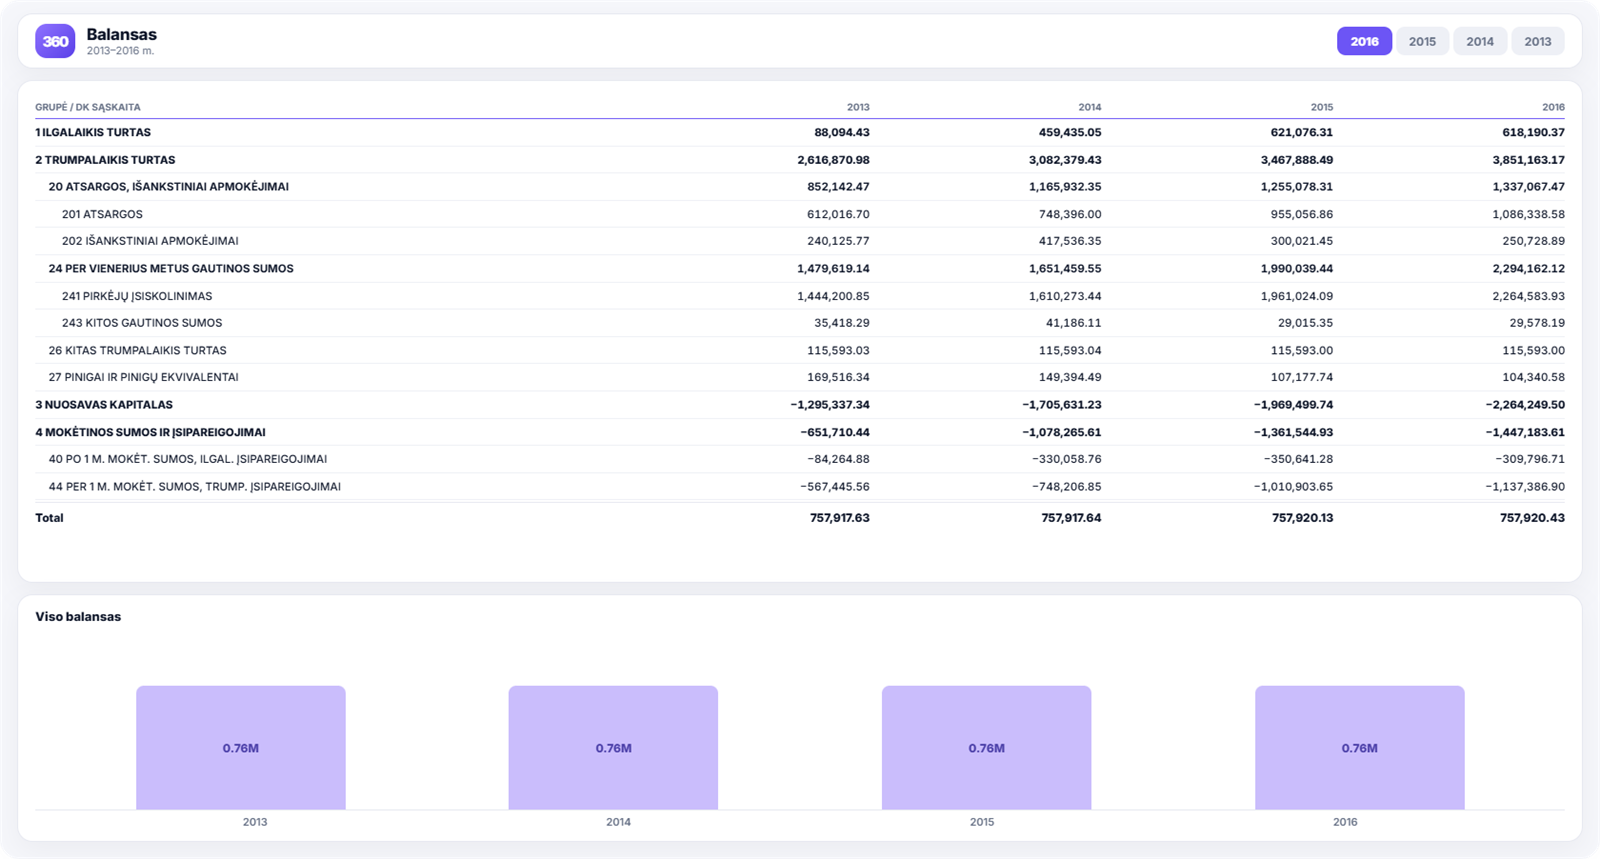
Most people associate the balance sheet with year-end reporting. In Power BI it becomes a working tool: several years’ balance sheets sit side by side, and every summary account can be expanded down to the detail.
Which decisions it helps you make
- How your asset structure is changing. Is inventory growing, or receivables — and which of them is growing faster than revenue?
- Whether liabilities are rising. The trend in current and non-current liabilities shows financial strain.
- How much cash is tied up. Taken together, the inventory and trade receivables lines show your working capital requirement.
- How you will look to the bank. A structured multi-year balance sheet with the detail behind it helps you prepare for a financing conversation.
What you see in the report
- the general ledger balance sheet by summary account;
- the option to drill down from each summary account to its detailed accounts;
- a comparison of several years’ balance sheets on a single screen;
- trends in selected balance sheet items over several years;
- a chart of the total balance sheet by year;
- convenient filtering and a one-click reset of filters.
How to read this report
It pays to look at ratios, not totals: trade receivables against revenue, inventory against cost of sales. If receivables are growing faster than sales, customers are paying later and later — you will see the problem in the debt report.
Secondly, keep an eye on lines that move unusually. On the balance sheet this is often the first sign that something has changed in your processes.
Four ratios worth calculating
The balance sheet becomes useful once you derive ratios from it. The four most important are:
- Current ratio — current assets against current liabilities. It shows whether there is enough cash for upcoming payments. A value below 1 means liabilities exceed the assets that can quickly be turned into cash.
- Receivables turnover — how many days, on average, customers take to pay. If the figure is rising, customers are paying later and later.
- Inventory turnover — how many days it takes for the warehouse to “turn over”. A rising figure means cash is sitting in stock for longer and longer.
- Debt-to-equity ratio — how much of the business is financed with other people’s money. This is the first thing a bank looks at.
None of them can be read from a single balance sheet line, but all four are calculated automatically when the data refreshes itself.
Working capital: where the cash goes
The most common question the balance sheet answers is this: why is the company profitable, yet there is no money in the bank account?
The answer almost always lies in two lines — receivables and inventory. The profit has been earned, but right now it is either with customers who have not yet paid, or in the warehouse in the form of stock.
Both lines are worth watching alongside sales growth. If sales grow by 10% while receivables grow by 25%, your growth is being financed with your own money. The detail is in the debt analytics and the slow-moving stock report.
When to look at the balance sheet
Year-end reporting is too late. In practice a quarterly review is enough — and always before two events: before a financing conversation and before a major investment.
Giving the bank a multi-year balance sheet in which every line can be expanded shortens negotiations, because questions are answered on the spot. Together with the profit and loss report, this is the standard set any lender will ask for.
How to get this report
The balance sheet report is included in both the Basic and PRO packages — for Rivilė and Finvalda users. You will find what each plan covers on the pricing page.