
Board Reports: How to Automate Them with a Power BI Implementation

In this context, board reports are automated Power BI reports that bring together data from Rivilė, Finvalda, Excel and SharePoint into a single real-time view. They show revenue, costs, profit, the balance sheet, sales and stock levels in one report, with no manual data entry. The best route to such a solution is not a large project from day one but a limited-scope POC (proof of concept), which shows within a few weeks whether the data and the model work in your board meeting.
In brief:
- It is important to start with a limited POC project, which within a few weeks reveals the quality of the data and whether the solution is fit for purpose.
- Automating reports lets the board see the same financial picture as the accounts department, without a delay of several days.
- Delivering the project requires clear KPIs and an inventory of data sources, and the technical implementation often calls for regular meetings with the IT department.
- Connections to data systems and access rights must be thought through in advance, using row-level security and clearly governed permissions.
- Data quality needs to be checked continually by comparing the new figures against trusted manual sources, so that errors do not find their way into decision-making.
Contents
- What automated reports bring to board decision-making
- How to commission a Power BI board report, step by step
- Technical requirements for integration with Rivilė, Finvalda and SharePoint
- How much a board report implementation costs and how long it takes
- How to define requirements and reach agreement with the IT department
- How to check data quality during implementation
- How access rights are managed in board reports
- The Analitika360 approach: practical experience of implementing Power BI board reports
- How to order a Power BI board report from Analitika360
- Sources
- Frequently asked questions
What automated reports bring to board decision-making
Manually compiled reports look backwards: by the time the accountant has gathered the figures from several systems, the month has often already ended. An automated Power BI report refreshes itself, so the board sees the same financial position as the accounts department, without a delay of several days.
The practical benefits fall into three areas:
- Time. There is no longer any need to copy data from Rivilė or Finvalda into an Excel spreadsheet by hand every month.
- Quality of decisions. Interactive visuals let you check straight away which branch or product is dragging profit down, rather than waiting for the next meeting.
- Speed of response. A deviation from plan is spotted within days, not within a month.
Pro tip: When calculating the return on investment, count not only the accountant’s hours saved but also how many times a year the board made a decision too late simply because the data was not available in time.
When report refreshes need no human intervention, as with the Finvalda and Power BI integration, the finance team can spend its time on analysis rather than copying data. Broader studies of the benefits of automation for business processes record a similar effect, showing that automated data flows shorten the decision-making cycle across the whole business, not just in the finance department.
How to commission a Power BI board report, step by step
Implementation does not have to be a long and unclear process. Microsoft’s implementation guidance recommends starting from business needs rather than technology, and real Power BI implementations at Lithuanian companies follow the same principle.
- Identifying business needs and KPIs. Sit the board, the finance director and the accountant down at the same table and write down which indicators they genuinely use for decisions, not which ones would be ‘nice to have’.
- Inventory of data sources. Review where the data currently sits: the Rivilė or Finvalda database, SharePoint folders, separate Excel files. This step shows how much work the integration will require.
- POC with real data. A limited-scope pilot project covering one or two KPI blocks, with success criteria agreed in advance. According to Microsoft, this allows data quality problems to be spotted early, before they become a risk to the whole project.
- Iterative development. The solution is refined in small steps, each time showing an updated version to the board or the finance team and gathering feedback.
- Launch, training and support. Users are trained to read and filter the report, and the supplier provides support when the data structure changes or a new source is connected.
Pro tip: Do not start the POC with the most complex KPI. Choose an indicator with the cleanest data, so that the first result shows the solution’s real value within a few weeks, rather than technical obstacles.
Technical requirements for integration with Rivilė, Finvalda and SharePoint
Before signing a contract with a supplier, it is worth checking a few technical points so that the implementation does not stall halfway.
First, Power BI licences differ by number of users and functionality. For some plans a standard licence is enough, while larger companies with many shared reports may need a Premium or Fabric-type licence. The choice depends on how many people on the board and in senior management will be viewing the report at the same time.
Second, a data gateway connection to the Rivilė or Finvalda database is needed, set up securely, without direct access to the production environment. For every field it must be clear which system it comes from. This field-source mapping is one of the most frequently underestimated parts of an implementation.
Third, it is worth understanding the limits of automation in advance:
- Data entry and refreshes can be fully automated when the source is a structured system such as Rivilė or Finvalda.
- Microsoft notes that some parts of a migration cannot be fully automated, particularly when the data comes from informal Excel files with their own logic.
- Checking business rules (for example, how the margin is calculated for a specific product) often has to remain a human responsibility, even when everything else refreshes automatically.
If you currently rely on Excel spreadsheets alone, it is worth reading up in advance on when it makes sense to move from Excel to Power BI, so that the technical change is not too abrupt.
How much a board report implementation costs and how long it takes
The budget breaks down into three parts: Power BI licences, consultancy hours and support after launch. The cost of licences depends on the number of users, the cost of consultancy on the complexity of the integration, and the cost of support on how often the data sources change.
The timeline also varies with the scope:
- A POC usually runs for a limited period, depending on how many sources need to be connected for the first trial.
- A full implementation with several KPI blocks and several data sources takes a few weeks, depending on the complexity of the project.
- The support phase is ongoing, because the data structure changes as the business does.
Pro tip: Ask the supplier for a clear proposal with specific deliverables for each phase, not a generic ‘implementation package’. That way you avoid a situation where the POC drags on because it was never clear when it would be considered finished.
When drawing up a brief for a supplier, it is worth setting out in advance the success criteria for the POC phase, a specific list of KPIs for the full implementation and the scope of support after launch. A brief like this lets you compare several suppliers objectively, rather than on overall price alone.
How to define requirements and reach agreement with the IT department
Most delays during implementation arise not from the technology but from the business side and the IT department speaking different languages. The finance director knows which KPI the board would like to see, but does not always know which database table that figure actually lives in.
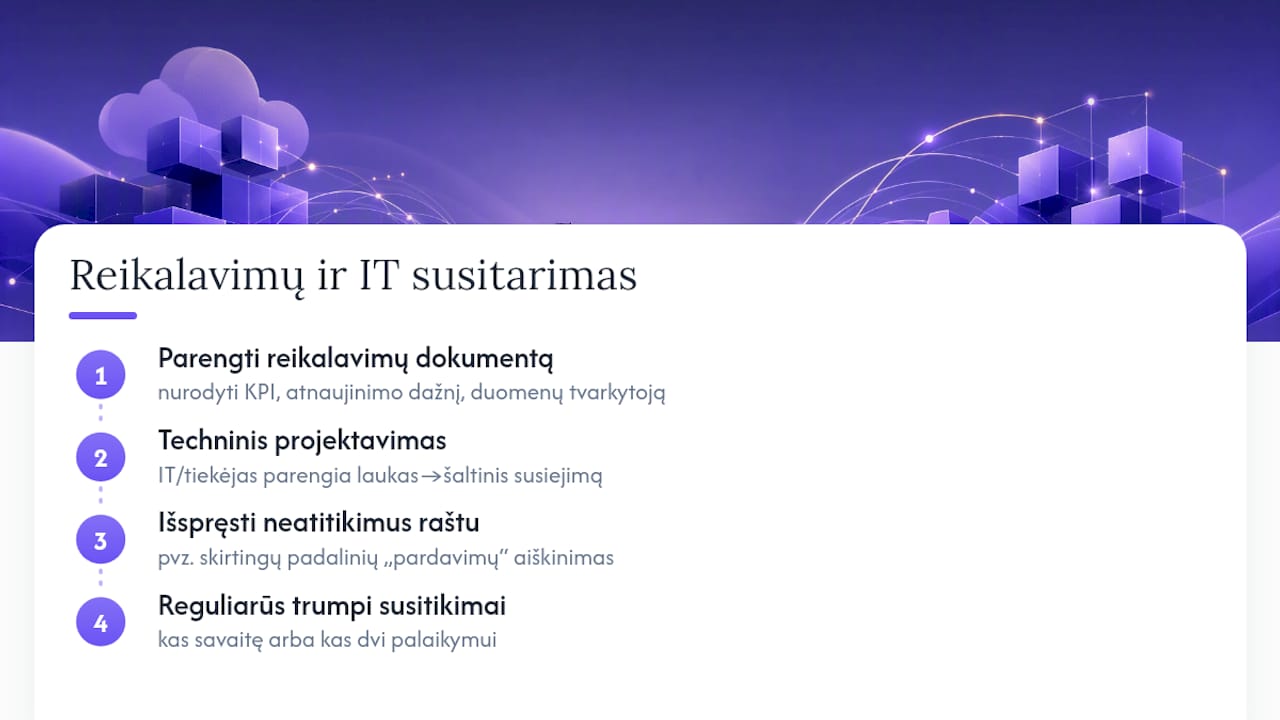
A practical solution is to prepare a short requirements document before the first meeting with the supplier or the IT department. It should cover three things: which KPIs need to be visible, how often they need to refresh, and who currently looks after that data (the Rivilė administrator, the accountant or an external accounting partner).
This document then becomes the basis for the technical design. The IT department or the supplier turns it into a field-source mapping, in which each KPI is linked to a specific field in Rivilė, Finvalda or an Excel file. Inconsistencies often surface at this stage, for example two different divisions calculating ‘sales total’ differently. It is better to resolve these inconsistencies in writing before the POC than to discover them when the board is already looking at the report and the figures do not match what they remember from the previous meeting.
Regular but short meetings with the IT or data department during the project (weekly or fortnightly) help keep up momentum, because every unanswered technical question can hold up an entire phase.
How to check data quality during implementation
An automated report is only as good as the data it shows. If the Rivilė or Finvalda database contains duplicate records, empty fields or categories named differently across divisions, Power BI will simply carry those same errors automatically into the board report, only now they will look more credible because they sit in a polished chart.
That is why every phase of the implementation must include a validation step: the figures in the new report are compared with the old, manually calculated versions of the reports for at least one or two consecutive months. If the figures do not match, the cause is investigated rather than glossed over in the hope that the problem will sort itself out.
In practice, several levels of checking are useful:
- Total check: total revenue or costs in the new report must match the balance produced by Rivilė or Finvalda.
- Structure check: categories and divisions must be named consistently across all sources, so that Power BI does not count them as separate rows.
- Timing check: the report refresh frequency must match how often the underlying data is updated; otherwise the board sees ‘lagging’ figures while believing them to be current.
This stage often takes longer than expected, but it protects against the worst possible outcome: a board decision made on the basis of incorrect figures.
How access rights are managed in board reports
A board report usually shows financial information that should not be visible to every employee in the company, so the access rights structure must be thought through from the first day of the implementation, not bolted on later as an extra feature.
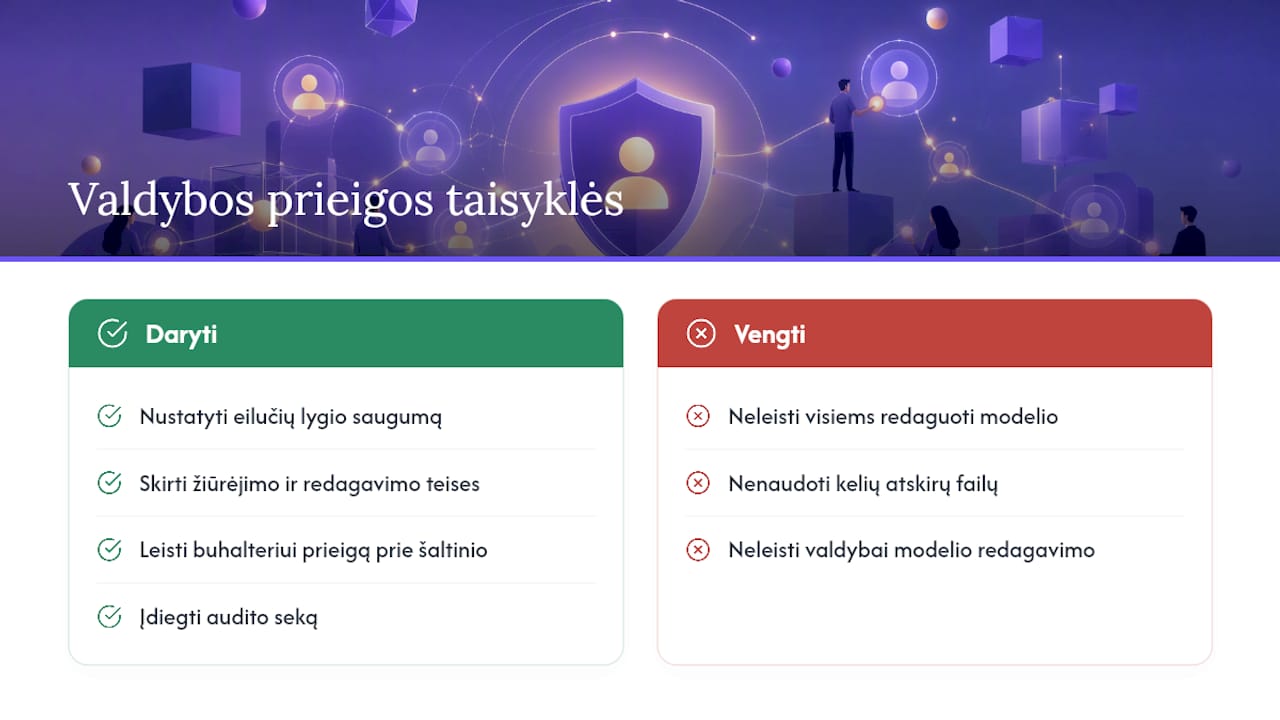
Power BI lets you set up row-level security, so that different users see different slices of data from the same report. For example, a branch manager can see their own branch’s figures, while a board member sees the summary for the whole company. This makes it possible to use a single report structure for several different audience levels without creating multiple separate files.
It is also important to distinguish between who can only view the report and who can edit the data model or connections. In practice, this means the accountant or finance director should have access at data-source level, while board members have view-only rights to the final report. This separation reduces the risk of someone accidentally changing the calculation logic before an important meeting.
It is also worth providing an audit trail: who viewed the report and when, whether there were any exports to Excel, and who has the right to add a new data source. These questions become particularly important when the report is used not only internally but also for reporting to investors or the bank.
The Analitika360 approach: practical experience of implementing Power BI board reports
Analitika360 organises the implementation through a POC with real Rivilė or Finvalda data, not demo samples, because that is the only way to see genuine data quality problems straight away. The solution is then refined iteratively, and the final report refreshes automatically, with no further user intervention, as described in the Rivilė integration example. Restaurant chains and accounting teams opt for this model when they no longer want to key in the same figures by hand every month.
— Analitika360
How to order a Power BI board report from Analitika360
If you already know which KPIs the board wants to see, the next step is not a lengthy technical project but a short pilot run with your own data. Both ready-built report packages and bespoke solutions are available, the latter for cases where the structure of the data sources is more complex.
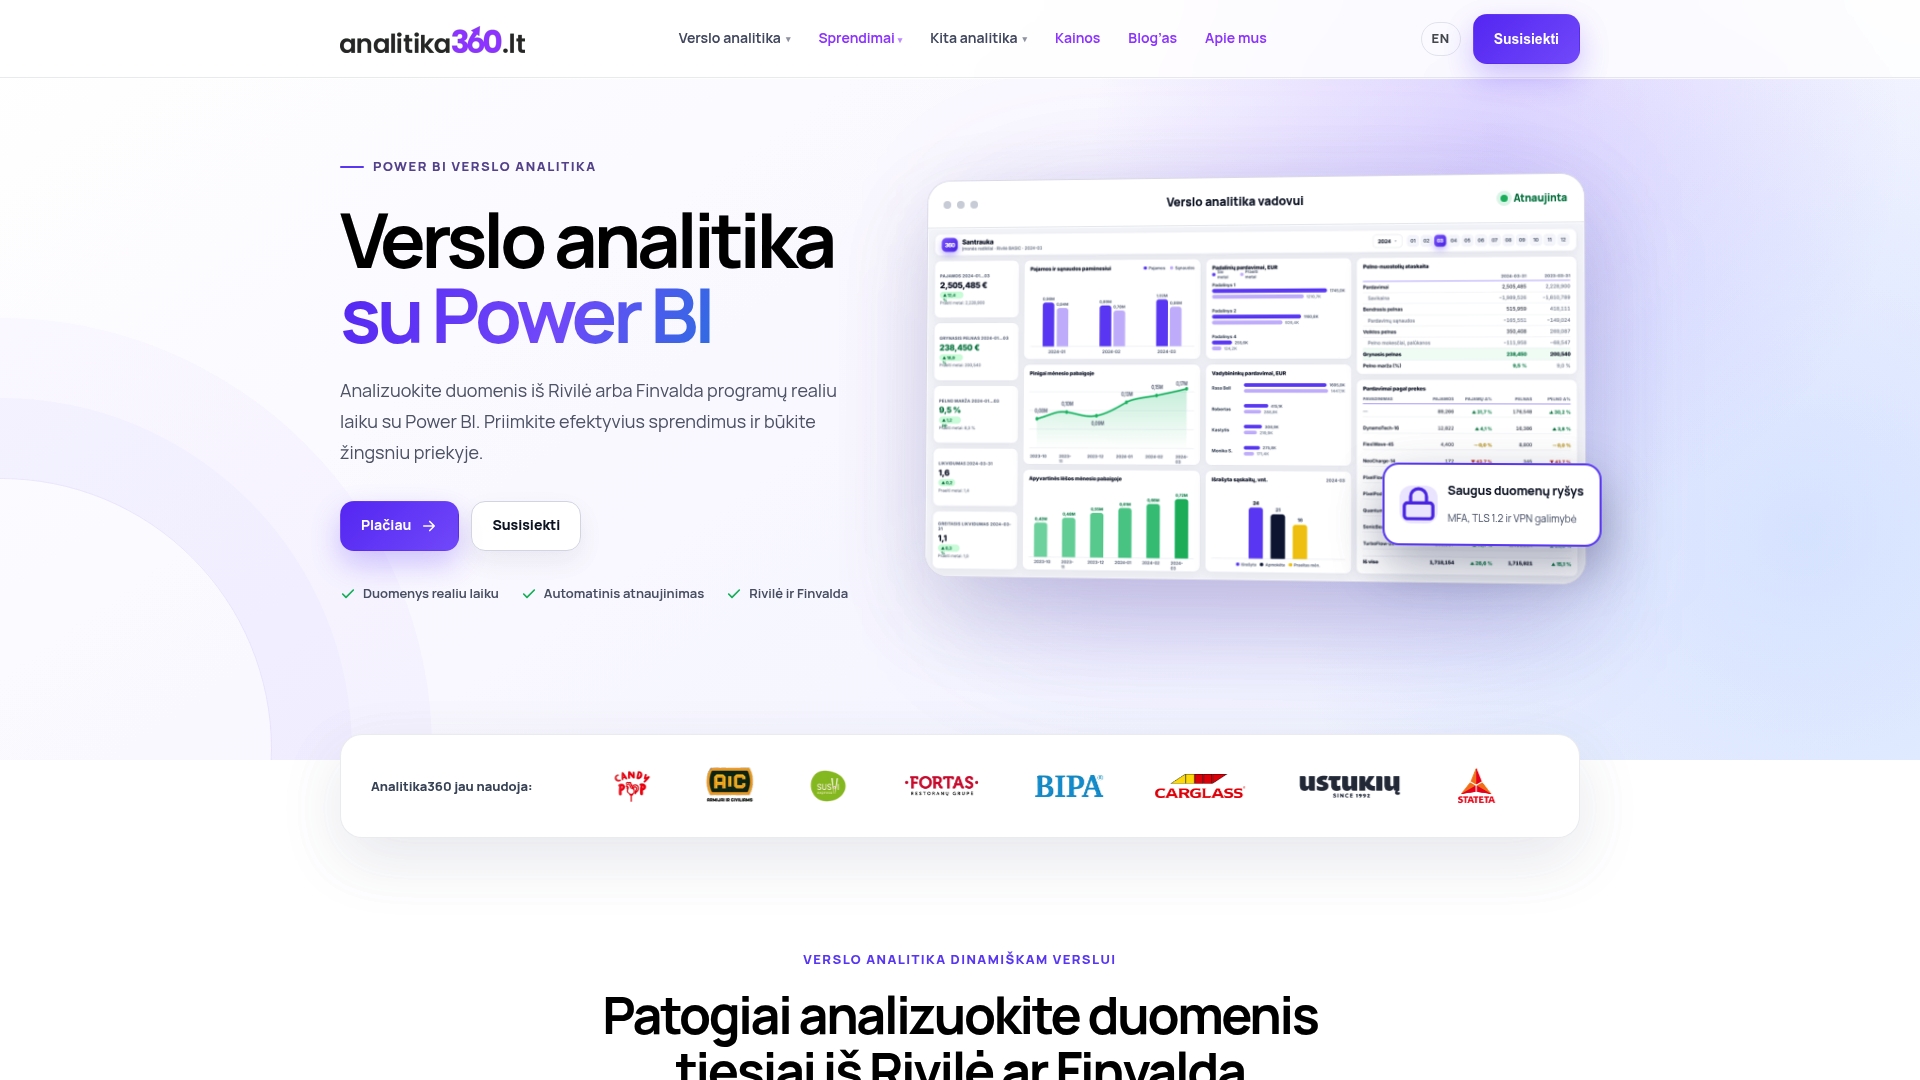
The POC phase runs on your company’s real data, not demo samples, so within a few weeks you can see whether the solution will genuinely solve the problems that led you to consider it: whether the board will see accurate figures on time, and whether stock levels will refresh without manual entry. A pilot run like this lets you make a decision with a concrete result in front of you, not just a supplier’s promise.
To see what such a report looks like in practice, browse the Power BI report examples or explore all our business analytics solutions, and get in touch for a POC proposal for your company.
Frequently asked questions
What is an automated board report based on Power BI?
It is a report that automatically collects data from Rivilė, Finvalda, Excel or SharePoint and shows revenue, costs, profit and other KPIs without manual data entry.
How long does a Power BI board report implementation take?
A POC usually runs for a limited period, while a full implementation with several data sources takes a few weeks, depending on the complexity of the integration.
Can the entire report refresh process be automated?
Collecting data from structured systems such as Rivilė or Finvalda can be fully automated, but some business rule checks often require human oversight.
Why start with a POC rather than a full implementation?
A POC lets you test data quality and the suitability of the solution on a limited scope, before investing in the whole project.
Can Analitika360 integrate data from several different systems in one report?
Yes, data from Rivilė, Finvalda, Excel and SharePoint can be integrated into a single automated Power BI report with real-time indicators.