
For Warehouse Managers: Rivilė Reports in Power BI with Analitika360
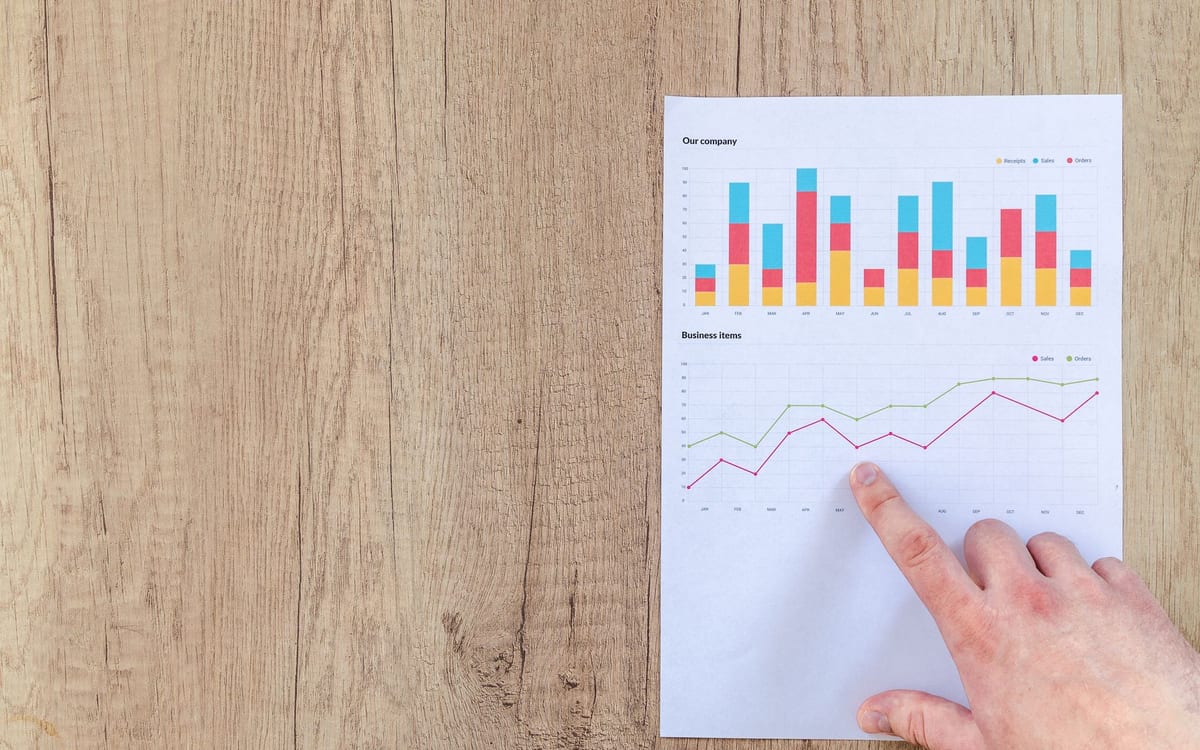
Rivilė’s warehouse reports show current stock levels, stock turnover and detailed inventory registers, and they can be exported or pulled into Power BI automatically. The system provides built-in report templates, which are managed under Nustatymai → Bendrieji (Settings → General) and generated either straight from the document list or via Servisas → Statistika (Service → Statistics). These two places are the best starting point, depending on whether you need a report on a single document or an overview of a whole period.
In brief:
- Start with the report templates under Settings or Service, depending on the period you want to review.
- Choose warehouse reports carefully according to their purpose, such as checking stock levels or meeting audit requirements.
- Exporting to Excel works best for further analysis and Power BI integration, while PDF suits fixed reports sent to customers or suppliers.
- Incorrect filters often produce misleading results, so it helps to use predefined views and set parameters properly.
- Warehouse data can be refreshed automatically and efficiently using Power BI and the API, giving you up-to-date stock levels and turnover in real time.
Contents
- Rivilė’s main warehouse reports: what they are and when to use them
- How to find and generate warehouse reports in Rivilė
- Which export format to choose: PDF, Excel, Word or email
- The most common mistakes in warehouse reporting and how to avoid them
- Rivilė and Power BI integration: how to pull warehouse data technically
- Which warehouse KPIs are worth tracking every week
- The Analitika360 perspective: how we help automate Rivilė reports
- How Analitika360 automates Rivilė warehouse reports
- Sources
Rivilė’s main warehouse reports: what they are and when to use them
Each warehouse report in Rivilė answers a different question, so it is important to know which one to use in a given situation.
- Current stock levels show the actual position right now. This report is useful for day-to-day control, when you need to check quickly whether an item is in stock.
- Inventory levels at a date capture the position at a chosen point in the past. Stocktakes and audits rely on this report.
- Stock turnover shows how much stock moves, and how quickly, over a chosen period. It helps to optimise purchasing and order frequency.
- The inventory register and the summary inventory register record every accounting transaction, allowing traceability by serial number or batch.
Rivilė ERP lets you analyse stock levels by department, object, serial number, batch and tag, and unit cost is calculated on a FIFO basis. This detail matters when several departments work with the same item records but different warehouses.
How to find and generate warehouse reports in Rivilė
Where you look for reports in Rivilė depends on whether you want to review a single document or a whole period.
- Open the report templates. Go to Nustatymai → Bendrieji → Ataskaitų šablonai (Settings → General → Report templates), where all the built-in reports are collected and can be viewed and edited.
- Use the printer icon in the document list if you want a report on one or more documents. Select the documents you need and choose the appropriate template.
- Go to Servisas → Statistika (Service → Statistics) when you need a bulk overview of stock levels or an analysis of a period. This route suits cases where you are analysing the overall state of the warehouse rather than an individual document.
Reports can be produced directly from the document list or via Servisas → Statistika, and the results go straight to on-screen preview, printing or export. Newcomers would do well to try the report templates on a small number of documents first, and then move the process into bulk mode.
Which export format to choose: PDF, Excel, Word or email
The choice of format depends on who the report is for and what you will do with it next.
- Excel suits cases where the data will be needed for further analysis, additional filtering or loading into Power BI.
- PDF is useful when you need a fixed, unchangeable version of the report, for example when sending it to a customer or supplier.
- Word is chosen rarely, usually when the report needs to be supplemented with comments or descriptions.
- Sending directly by email lets you send the report from the system without the extra step of going through your email client.
Rivilė supports on-screen preview, printing and export to PDF, Excel and Word, as well as sending by email directly from the application.
Pro tip: Before running a large bulk export, test the report on one or two documents first. That way you will spot filtering errors early and avoid wasting time generating a faulty file with thousands of rows.
The most common mistakes in warehouse reporting and how to avoid them
The vast majority of inaccurate warehouse reports stem not from limitations of the system but from poorly chosen filters.
- Incorrect filters distort the entire report: for example, a missing department or object gives a partial and misleading picture. Experts recommend creating user-specific views with predefined filters, so that each employee sees only the data they need.
- Zero balances are hidden by default in summary registers. If an item has sold out to zero, it simply will not appear in the report unless you change the display settings separately.
- SVS (warehouse management system) parameters (such as SVS_REZIMAS) and the configuration of alternative barcodes must match how the warehouse actually operates, otherwise scanning data will not be reflected correctly in reports.
- Unchecked item classifiers, such as product groups and labels, break down analysis by category before it has even begun.
The inventory register records all posted transactions, but zero balances are hidden by default, so you need to adjust the filters separately to see the full history.
Rivilė and Power BI integration: how to pull warehouse data technically
Rivilė’s warehouse reports are well suited to day-to-day operations, but for forecasting, profitability analysis or comparing several departments, single-window system reports are no longer enough. This is where Power BI integration comes in.
The technical process consists of several steps:
- Call GET /bi/schemas to find out which data fields and structures are available for export.
- Build a filter JSON with the required conditions (period, department, product group).
- Call GET /bi/collect with that filter and an X-SessionToken header for authentication.
Rivilė offers API access for BI integration. GET /bi/schemas and GET /bi/collect are the main calls in this process, and the results are cached in the system for 8 hours, so repeated identical calls within that period return faster than a fresh calculation.
For larger data volumes, experienced specialists opt for an ETL solution or a staging database rather than a direct call every time a Power BI report is opened. For inventory management analytics in Power BI, it is advisable to call the schema first, as this protects the system from unnecessary load and reduces the risk of faulty queries. In Power Query, it is easiest to set a data refresh schedule straight away that matches the 8-hour cache cycle; otherwise users will see out-of-date figures without understanding why.
Which warehouse KPIs are worth tracking every week
A warehouse manager does not need to check every report daily. What matters more is seeing, regularly, the indicators that genuinely signal a problem.
- Weekly stock turnover shows which product groups move faster and which are getting stuck in the warehouse.
- Trends in current stock levels let you spot slow-moving stock before it ends up being written off.
- Supplier and product profitability indicators linked to the general ledger reveal which product lines actually generate profit and which merely clog up the warehouse. By integrating stock movements with general ledger entries, finance managers get a more reliable picture of inventory value than by looking at the inventory module on its own.
Pro tip: When the weekly turnover report shows an item with a steadily falling balance and strong demand, that is a signal to reorder now, not next week. The opposite situation, a rising balance with no sales, usually means it is time to consider a write-off or a promotion.
The Analitika360 perspective: how we help automate Rivilė reports

Most of the warehouse managers we work with initially treat Rivilė reports as a separate tool they open once a week. That is a mistake. When warehouse data is combined with sales and financial indicators in a single Power BI dashboard, patterns emerge that simply cannot be seen in a standalone report, such as how a particular supplier’s delivery delays correlate with stock shortages in certain shops. Analitika360 provides automated reports and integrations with Rivilė designed to reveal such relationships without extra manual work.
Restaurant chains and accounting firms working with several departments already use our ready-made PRO packages, where data refreshes automatically without any intervention from the user. If you would like to see how this would look with your warehouse data, get in touch to arrange a demonstration.
— Analitika360
How Analitika360 automates Rivilė warehouse reports
Analitika360 is an alternative to manual Excel work with Rivilė warehouse data: the warehouse manager no longer needs to export separate reports week after week and stitch them together by hand into a single view.
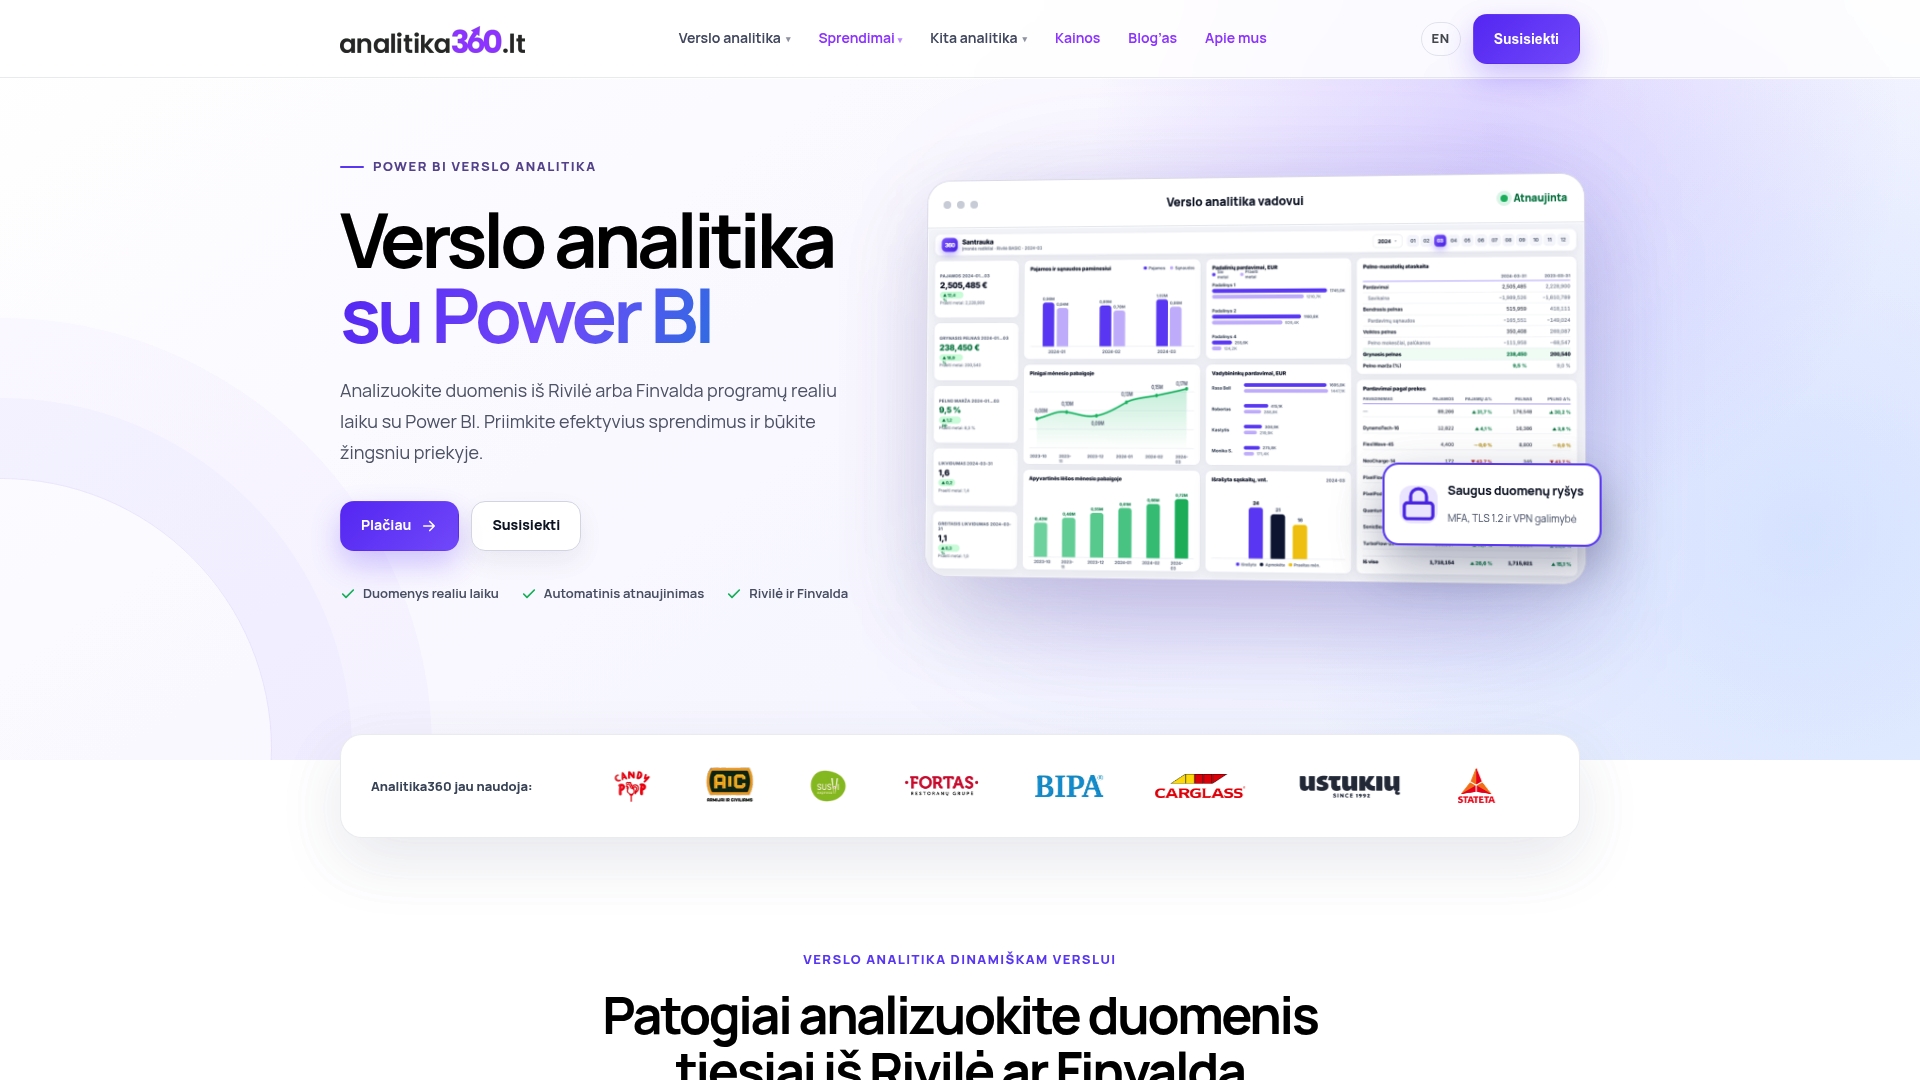
Instead, data from Rivilė refreshes automatically in a Power BI dashboard, where stock levels, turnover and profitability are visible in one place in real time. We tailor the specific features of our business analytics packages to the size of your warehouse and your sector, and you can see sample results in our Power BI report examples. If you want to move from standard Rivilė reports to an automated BI solution, we recommend starting with a Power BI implementation consultation, where we review your warehouse data structure together and draw up a concrete implementation plan.
Sources
You will find more technical detail in the Rivilė ERP guide on inventory registers and in Technaujienos reviews of warehouse automation.
- Stock and inventory levels and turnover | Rivilė GAMA guide