Your business in 360°
Warehouse Stocktaking with Power BI: Stock Levels, Discrepancies and KPIs

A warehouse stocktake with Power BI speeds up once stock levels, stock movements and inventory value flow into the report straight from the accounting system and refresh on their own. The stocktake committee then compares the physical count not with yesterday’s Excel file but with what Rivilė or Finvalda shows today. This guide covers the data you need, how to build the report step by step, which KPIs matter and where mistakes are most often made. For Rivilė and Finvalda users, Analitika360 offers ready-built Power BI report packages with automatic data refresh, so you can hand most of the technical work over to us.
In brief
- A stocktake compares actual stock levels with the accounting records, and companies must carry one out at least once a year before preparing their annual financial statements.
- A Power BI report needs three layers of data: stock levels, movements (purchases, sales, write-offs) and a product catalogue with prices.
- The most common mistakes: splitting value between warehouses, summing stock levels across several dates, and entries posted directly to the inventory account.
- The report is only useful if it refreshes automatically: a manual export before each count is out of date within a few hours.
- Analitika360 packages for Rivilė and Finvalda start at €59 a month and refresh without any extra work from the user.
Contents
- What a stocktake means and why Power BI suits it
- What data a stocktake report needs
- A stocktake report in Power BI: six steps
- KPIs that show more than quantity
- Common mistakes and how to avoid them
- How to refresh and share the report
- Ready-built packages for Rivilė and Finvalda users
- Our view
- FAQ
- Sources
What a stocktake means and why Power BI suits it
The Law on Financial Accounting defines a stocktake as the verification of assets and liabilities and the comparison of their actual balances with the data in the accounting records. Under the Inventory Count Rules approved by the Government, companies outside the public sector must count all their assets at least once a year, before preparing their annual financial statements. Article 13 of the same law provides that the head of the company ensures that account balances are supported by stocktake data.
In practice, the annual stocktake is only the minimum requirement. Restaurant chains, retailers and logistics companies check their stock more often: monthly, weekly or selectively by product group. Every such check needs the same thing: an accurate book stock figure for a specific date, grouped the way the goods are actually laid out in the warehouse.
This is where Power BI clearly earns its place. Instead of several exports and VLOOKUP formulas, a single model shows stock levels, value, movements and discrepancies, and filters let you drill down from the whole warehouse to a single shelf or product group in seconds.
What data a stocktake report needs
The official Rivilė ERP guide states that data for analytics is pulled via the Rivilė BI API, with a separate data source, INVENTORY_STOCK, for inventory balances. A stocktake report usually needs the following sources:
| Data source in Rivilė | What it gives the report |
|---|---|
| INVENTORY_STOCK | Inventory balances by product and warehouse |
| PURCHASE_INVOICE_DETAILED | Goods received and purchase prices |
| SALES_INVOICE_DETAILED | Sales and goods issued |
| PRODUCT | Product catalogue, groups, units of measure |
| PRICE | Prices for valuation and comparison |
| GENERAL_LEDGER | General ledger balances for reconciliation with the accounts |
The same guide recommends retrieving the exact field schema for each source from the schema query every time, as fields may change. For Finvalda users the logic is the same: stock levels, movements and the product catalogue, just by a different technical route. We cover this in more detail in our article Finvalda API and Power BI.
If some of the data lives in Excel tables, such as the quantities counted by the stocktake committee, it can be connected to the same model. We explain how to do this properly in our guide Rivilė, Excel and Power BI.
A stocktake report in Power BI: six steps
- Connect the accounting system. Power BI is connected to the Rivilė or Finvalda API, and parameters are set up for access and the date range. The most common mistake: the data is pulled once by hand, and a week later the report is already showing the past. In Analitika360 packages this connection is already configured and refreshes automatically.
- Tidy up the product catalogue. Product codes, groups and units of measure must match what is entered on the count sheet. If the same product is kept in the accounts in kilograms but counted in boxes, the discrepancy will arise not in the warehouse but in the report.
- Build a star schema. Fact tables (stock levels, movements) are linked to dimensions (product, warehouse, date). This lets you slice any measure by any dimension without duplicated rows.
- Connect the physical counts. The quantities counted by the committee are loaded from Excel or a scanner file by product code and warehouse.
- Calculate the discrepancies. Discrepancy in quantity and value, percentage variance, and shortages and surpluses shown separately. This makes it immediately clear which product groups account for most of the losses.
- Build a review page. A ‘product × warehouse’ matrix with book stock, physical count and discrepancy, alongside a filter showing only the rows above a set threshold. That way the committee recounts only what genuinely does not match.
KPIs that show more than quantity
A stocktake answers the question ‘does it match?’, while a good report also answers ‘why?’. These are the KPIs worth tracking:
- Stock in quantity and value at the last selected date.
- Discrepancy between the books and the physical count, in quantity, euros and percentage terms.
- Days of cover: how many days current stock will last at the average rate of issue. Usually calculated with the DAX function DIVIDE(Likutis; DIVIDE(Išlaidota per 30 d.; 30)). If there were no sales, the result is blank, and that is correct: there simply is no cover figure. It is worth stating the period (e.g. 30 days) in the report heading.
- Slow-moving items: stock exists, but nothing was issued during the selected period.
- Stock turnover: how many times inventory turns over during the period. We discussed it in detail in our article warehouse stock turnover in Power BI.
For restaurant owners these KPIs are particularly useful for perishable goods: a slow-moving item in the kitchen quickly becomes a write-off.
Common mistakes and how to avoid them
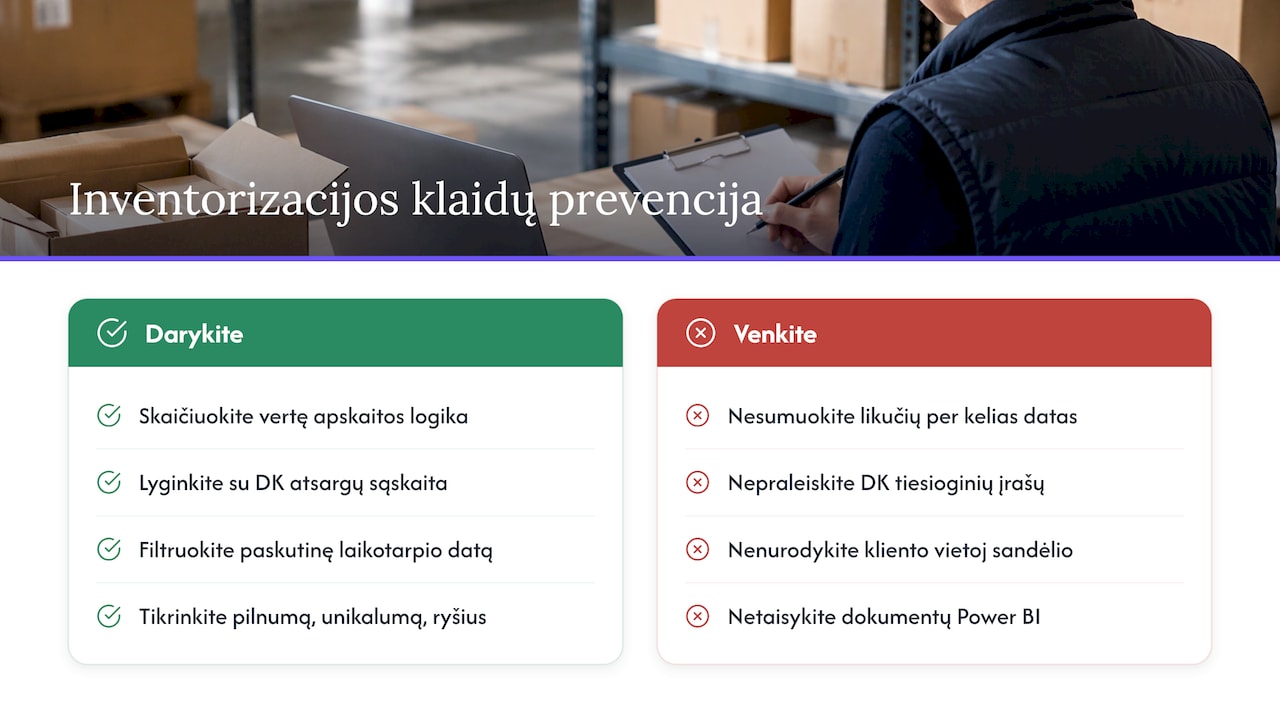
Splitting value between warehouses. When the system calculates cost as a single moving average for the whole company, quantity belongs to the warehouse but value belongs to the company as a whole. The documentation for JARS, a Lithuanian accounting system, shows that when value is split between warehouses one warehouse can ‘hold’ minus €50 without a single unit in stock, even though the overall total remains correct. So in the report, value by warehouse must be calculated using the same logic as in the accounting system.
Entries that bypass the warehouse module. The BSS user guide warns that warehouse reports will not include amounts posted directly to the inventory account through accounting memos. For this reason, it is worth comparing the warehouse balance in the Power BI model with the inventory account in the general ledger and showing the difference on a separate line.
Summing stock levels across several dates. If the stock table holds several snapshots (for example, the balance for each day), a simple SUM over a week will show stock seven times higher than it really is. Stock must be filtered to the last date of the selected period and only then summed.
Incorrect documents. The Butenta instructions describe a case where a document listed a customer instead of the receiving warehouse. Power BI helps find errors like these faster, but they need to be corrected in the accounting system itself.
For ongoing control, we suggest using our data quality checklist: checks on completeness, uniqueness and relationships between tables catch most problems before the stocktake even begins.
How to refresh and share the report
A stocktake report is only valuable if the committee sees fresh data. A Power BI Pro licence allows up to 8 scheduled refreshes a day in the Power BI service, and a manual refresh is possible at any time. For most warehouses this is enough: for example, a refresh in the morning before the count and another in the afternoon once adjustments have been entered.
Three practical tips:
- Incremental refresh. Only new records are reloaded, so a large volume of movement history does not clog up the model. You will find how to set it up in our guide to incremental refresh in Power BI.
- Data gateway. If the accounting database sits on the company’s own server, a cloud report needs a gateway. More here: Power BI data gateway.
- Access rights. It is worth giving the warehouse manager, the accountant and committee members different views: the committee only needs quantities, while the finance director needs values.
Managers of restaurant and other chains will appreciate that the same report also works on a phone, so stock levels can be checked right there in the warehouse.
Ready-built packages for Rivilė and Finvalda users
If you would rather not build the API connections, star schema and refresh schedules yourself, Analitika360 offers ready-built Power BI report packages in which warehouse, sales, debt and profit KPIs refresh automatically, with no extra work from the user.
- Rivilė Basic and Finvalda Basic: €59 a month.
- Rivilė PRO and Finvalda PRO: €89 a month.
- Custom projects, when the report needs to be tailored to your company’s processes or combined with Excel, SharePoint, CRM or logistics data: €70 an hour.
Microsoft Pro and Premium licences can be purchased through us. You will find all plans on our business analytics pricing page, and we describe examples of warehouse reports in our articles on Rivilė warehouse reports and Finvalda warehouse reports.
Our view
A stocktake is often treated as an annual obligation to be ‘done and forgotten’. We see it differently: it is the best moment to check whether the accounting data can be trusted at all.
Many of the discrepancies the committee finds in the warehouse arise not on the shelves but along the data path: in inaccurate units of measure, manual exports and out-of-date files. That is why we build report sets that pull data from Rivilė and Finvalda automatically and combine different sources into a single Power BI model.
When stock levels, movements and value refresh on their own, a stocktake stops being a one-off campaign and becomes continuous control. The accountant spots discrepancies sooner, the finance director gets a reliable balance sheet line, and the owner spends time on decisions rather than reconciling spreadsheets.
Analitika360
FAQ
Does Power BI replace the count sheet?
No. The count sheet and decisions on discrepancies are approved by the committee and the head of the company under the Inventory Count Rules. Power BI prepares accurate book stock figures, compares them with the physical count and shows where to look for the causes of discrepancies.
How long does it take to prepare a warehouse report?
It depends on the state of the data and the number of sources. With a ready-built Analitika360 package, a Rivilė or Finvalda user does not need to build the connections and model from scratch, and we carry out custom adaptations as a project at €70 an hour.
Can I connect an Excel file with physical counts?
Yes. Physical counts from an Excel or scanner file are linked to the model by product code and warehouse. The key thing is that the codes and units of measure match the accounting system.
Why does the report’s value not match the general ledger?
Most often because of entries posted directly to the inventory account through accounting memos, or because value is split between warehouses. A good report shows this difference on a separate line so that it can be explained.
What licence do I need to share the report?
Sharing in the Power BI service usually requires a Pro licence, and Premium for larger needs. Both licences can be purchased through Analitika360.
Sources
- Law on Financial Accounting (infolex.lt)
- Article 13 of the Law on Financial Accounting (infolex.lt)
- Inventory Count Rules, Government Resolution No. 719 (e-seimas.lrs.lt)
- Rivilė ERP: for analytics, reporting and data export
- JARS Apskaita: inventory balances
- BSS: correcting inventory errors in the warehouse and reports
- Butenta: checking warehouses
- Refresh your data in Power BI (docs.wiise.com)