
Subscription reports: how to choose the right solution for managers

A subscription Power BI report gives a manager a financial overview that updates in real time and frees up the hours an accountant or analyst used to spend putting reports together by hand. It works best when it connects automatically to Rivilė or Finvalda data and delivers reports on a schedule agreed in advance. Below you will find criteria for assessing a package, how the licensing works and the concrete steps for ordering this kind of service from Analitika360.
In short:
- If an organisation rolls out subscription Power BI reports with automatic data refresh, they can be tailored to its specific KPIs and the frequency it needs.
- Reliability and agreement with the source data are critical, because any errors erode the manager’s trust and the quality of decisions.
- Package prices depend on the licensing model chosen (Pro, Premium Per User or capacity) and may include additional features or extra data sources.
- Automated delivery and the ability to apply custom filters remove manual work and make data more accessible to different users.
- Rollout runs from data integration through to user configuration and depends on the size of the company and the complexity of the chosen data sources.
Contents
- What subscription reports are and the value they bring
- Key features and delivery options
- How to choose the right subscription package
- Pricing and licensing: what to budget for
- The rollout process and a typical timeline
- Terms and conditions: how to cancel or change a subscription
- Performance and reliability guarantees for subscription reports
- Possible package upgrades and additional features
- The supplier’s perspective: how subscriptions are delivered
- How to order Analitika360 subscription reports
- Sources
What subscription reports are and the value they bring
Subscription reports are sets of reports built on Power BI that refresh automatically and reach the recipient at an agreed time, without anyone having to download data or assemble tables by hand. The manager receives not a static file but a live view: the figures change every time the accounting system is updated.
A typical subscription covers several core metrics that recur in the vast majority of business reports:
- revenue and its trend by week, month and quarter;
- cost structure by department or project;
- net profit and profit margin;
- receivables ageing (how much customer debt is overdue by more than 30, 60 or 90 days);
- inventory levels and turnover.
One important distinction is worth understanding: the ERP system (for example, Rivilė or Finvalda) is the primary data source, where every transaction is recorded and the statutory reports are produced. A Power BI report does not take over that role; it remains a management analytics layer that turns the data into a view useful for decision-making. This separation matters when you consider how far a subscription report can be trusted: it shows trends and warning signs faster than any manual summary, but official tax and legal reporting is still done from the ERP system.
Key features and delivery options
What sets a good report subscription apart from a simple dashboard is that it runs without constant human involvement. The system refreshes the data itself, follows the schedule and sends the results to recipients.
- Automated data refresh. The report pulls the latest entries from the accounting system on a preset schedule, for example early every morning or every Monday before the management meeting.
- Recipient management and personalisation. A single data model can generate different views: the finance director sees the full P&L, while a department head sees only their own department’s figures.
- Export formats. Reports can be delivered as a PDF, an Excel file or an interactive Power BI view, depending on whether the recipient just wants to look at the figures or analyse them personally.
- Delivery channels. Scheduled delivery works via email, SharePoint or Teams, and specialised automation tools let you tailor the filters and format for each recipient.
- Anomaly detection and summaries. Some modern solutions also generate a written summary that highlights unusual changes, such as a sudden jump in costs in a particular department.
- Access and security management. Separate workspaces, user roles and row-level security (RLS) ensure that each recipient sees only the data assigned to them.
Expert tip: Before you approve the subscription schedule, ask yourself when you actually make decisions. If the management meeting is on Monday morning, the report needs to be ready on Sunday evening, not on Monday afternoon.
How to choose the right subscription package
Before signing a contract with any supplier, it is worth working through a few practical checkpoints. This will save money and protect you from a situation where the report looks attractive but does not meet your real decision-making needs.
- Define the key KPIs and refresh frequency. A restaurant chain may need daily sales data, while a construction company can manage with a weekly cost summary.
- Check data source integration. Make sure the supplier genuinely has experience with the accounting system you use, specifically Rivilė, Finvalda, a POS till system or a CRM.
- Assess your licensing needs. How many people in the organisation need access to the reports determines whether Power BI Pro will suffice or whether the capacity model is worth considering.
- Ask about the service level agreement (SLA). What happens if a data source is temporarily unavailable? How quickly are technical faults resolved?
- Check data security practices. Where are login credentials stored, how are user permissions managed, and is row-level security applied?
- Watch out for red flags. If a supplier offers only manual refresh, has no standard export formats or hides extra charges for every change, that is a sign to look for another partner.
This checklist applies to a package of any size, but a small company will be well served by a simpler set with a few KPIs, whereas a group of companies will often need a consolidated report that brings several divisions together in a single view.
Pricing and licensing: what to budget for
Power BI pricing has several main tiers that directly affect how much a subscription will cost your organisation. Microsoft’s licensing documentation distinguishes between the Fabric (free), Power BI Pro and Power BI Premium Per User (PPU) plans, each offering a different scope for sharing and collaboration.
- Power BI Pro suits organisations where a limited number of users create and share reports, usually the finance team and a few managers.
- Power BI Premium Per User unlocks additional premium features for each user individually and suits cases that need more complex models or larger data volumes.
- The capacity model is worth choosing when an organisation has many users or wants to share reports widely without buying a per-user licence for everyone, as Microsoft’s deployment planning guidance also notes.
On top of the licence cost there are often other expenses: building the initial model, connecting the data sources and configuring personalised filters and automated delivery tools. Indicative price levels can be found directly on Microsoft’s website, and you will find a broader analysis of what a Power BI rollout really costs a company in this article.
The rollout process and a typical timeline
Rolling out a subscription report happens step by step, and each stage has its own purpose.
- Data mapping. The sources to be connected are identified (accounting system, Excel, CRM, warehouse software), along with the most important fields.
- Building the data model. The relationships and calculation logic are created, which then feed all the visualisations.
- Testing. Checks are made that the figures match the ERP system data and that the refresh runs without errors.
- User configuration. Access rights are assigned and filters are configured for each recipient.
- Go-live. The report starts running on the agreed schedule and the client receives the first automated deliveries.
How long the rollout takes usually varies with its scope: a few weeks is enough for a small company with a single data source, whereas for a group of companies with several divisions and several accounting systems the process takes longer. The client’s role at this stage is specific: provide access to the data sources, appoint a responsible contact person and confirm which KPIs matter most. At the acceptance stage it is worth checking three things: whether the figures match the official accounts, whether the export formats meet your needs, and whether the automatic refresh has run reliably for at least several weeks in a row.
Terms and conditions: how to cancel or change a subscription
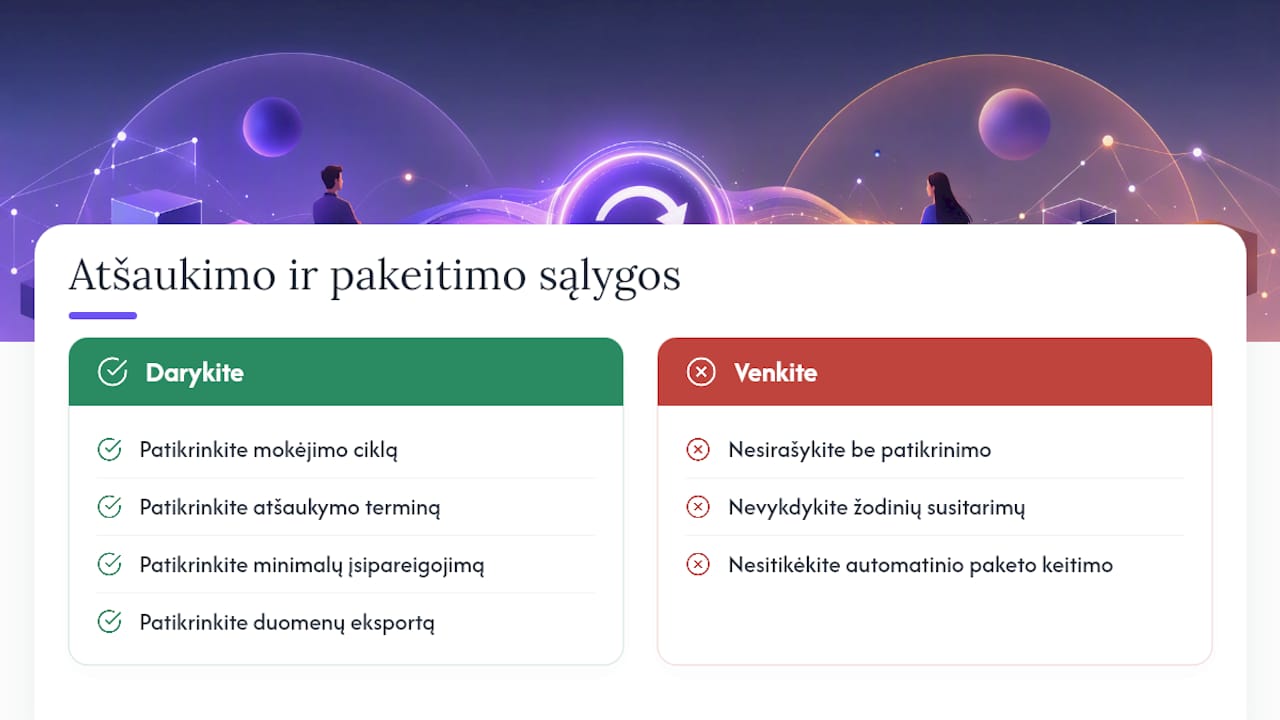
Depending on the supplier, subscription terms usually provide for a monthly or annual billing cycle, with changes possible at the end of the current period. Before signing a contract, check how many days’ notice is required for cancellation and whether there is a minimum commitment period.
Changing the package is often simpler than cancelling outright. If the company needs an additional data source or a new set of KPIs, this can be added between billing cycles without waiting for the contract renewal date. It is important to understand in advance whether the subscription terms allow you to scale the package down temporarily, for example during a seasonal period when business volumes fall.
If you cancel the subscription, it is worth agreeing in advance what happens to the data models and visualisations already built. Some suppliers let the client take the exported model files, while others treat them as part of their intellectual property, depending on the contract terms. This point is often forgotten during negotiations, yet it directly affects how easily the company can move to another solution should it need to in future.
A practical tip: ask for a draft contract in writing before you sign, and check that it clearly states the cancellation notice period, the billing cycle and the conditions under which the package can be changed without an extra charge.
Performance and reliability guarantees for subscription reports
A report loses its value the moment a manager stops trusting the figures. That is why reliability in this area is not an optional extra but the basic condition for a subscription to work at all.
In practice, reliability comes down to three things. First, refresh stability: the report must refresh at the same time every time, without exceptions and without silent failures. Second, agreement with the source data: every metric in the Power BI view must reproduce what is recorded in the accounting system, with no hidden calculation errors. Third, a rapid response to technical disruptions when a data source is temporarily unreachable because of server maintenance or a system update.

It is worth noting that automated reports prove their worth best in practice when they run entirely on their own. One project example shows that before automation an analyst spent several hours a week preparing reports, whereas after rollout the report was ready automatically early every Monday morning, with no human intervention required. Stability of this kind is no accident; it is the result of a well-configured data model and schedule.
In practical terms, reliability guarantees also mean a clear agreement on who is responsible if a report does not refresh on time. Before signing a contract, ask how many hours the supplier takes to fix a technical fault and whether there is a backup notification channel if automated delivery fails.
Possible package upgrades and additional features
A subscription rarely stays the same for the whole contract period. As a business grows, there is usually a need to add new data sources, extra metrics or a wider group of users.
Typical upgrade paths follow a few scenarios. A company that started its subscription with one accounting system may, after a few months, connect its CRM data so that the sales report covers the customer journey and not just invoices. Another company, as its user numbers grow, may move from per-user licences to the capacity model to avoid rising licence costs.
Additional features worth bearing in mind when planning the budget ahead:
- connecting data from new divisions or branches to the existing model;
- building additional KPI sets for a specific sector, for example metrics based on labour hours and parts usage for car repair workshops;
- switching on an anomaly detection layer that automatically flags unusual changes;
- building a consolidated report when a group of companies wants a single view across all its divisions.
These changes usually do not require starting the rollout from scratch. A well-built data model lets you add new elements gradually, without having to rebuild the whole system.
The supplier’s perspective: how subscriptions are delivered
This service works directly with Rivilė and Finvalda data, which changes the approach to rollout: integration happens without any extra manual exports, and the report refreshes automatically every night. Different sectors, such as restaurant chains or car repair workshops, need different metrics. A restaurant needs to see its daily sales flow by outlet, while for a car repair workshop the analysis of parts usage and labour hours matters more.
For the first meeting, the client should prepare three things: login details for the accounting system in use, a sample of an existing report (even if it is in Excel) and a list of the people who should receive the final report. This makes it possible to understand the real scope from the very first conversation rather than guessing.
How to order Analitika360 subscription reports
If you are reading this article, your team has probably already tried to solve its reporting problem with Excel files or by copying data from accounting systems by hand. The solution on offer is ready-built Power BI report packages that connect to your accounting system and refresh without constant human involvement, which means fewer hours spent assembling tables and more time for making decisions.
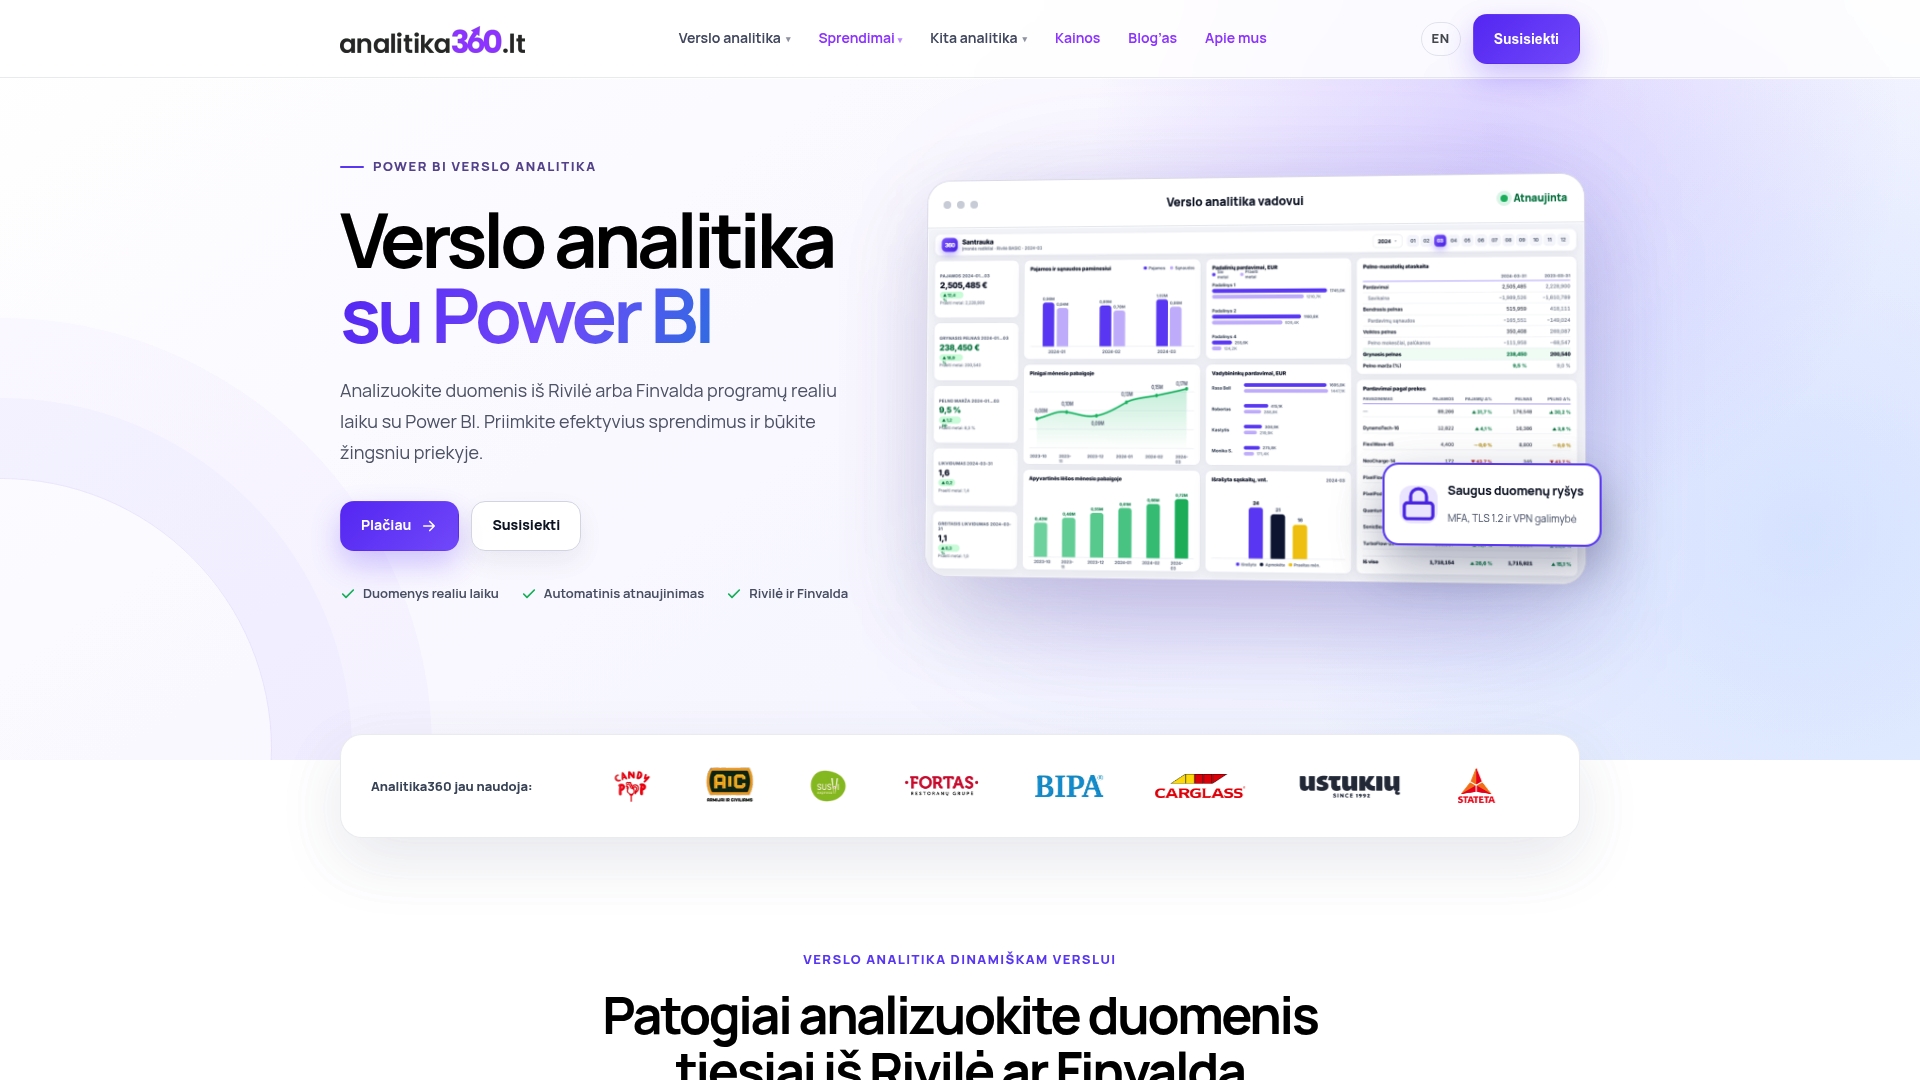
Within the first month, the client receives a configured data model linked to its accounting system and the first automated report deliveries on the agreed schedule. Before the first meeting, it helps to have access to your Rivilė or Finvalda system ready, a few examples of the reports you currently use and a contact person who will be responsible for approving the KPIs.
You will find the full list of solutions by business sector on the main services page, and if you would like to see what the finished result looks like first, browse the Power BI report examples and get in touch to arrange a personal demonstration.
Sources
For those who want to look more closely at the licensing details, Microsoft’s documentation on licence types and its deployment planning guidance explain the differences between the Pro, PPU and capacity models.
You will find the practical integration steps in the articles on connecting Power BI to Rivilė and Finvalda integration. If you are considering moving from Excel to an automated solution, the comparison Excel or Power BI will help you decide, and companies with international operations may find it useful to see how a currency exchange budget is drawn up.
- Power BI service features by license type - Power BI | Microsoft Learn
- PowerBI Robots – Automate Power BI Report Delivery | PowerBI Tiles Suite
- AI Automated Reporting | Power BI, Tableau & Dashboards