Your business in 360°
 B2B customer segmentation: how to group business customers and tailor your offer

B2B customer segmentation is the systematic grouping of customers by their needs, behaviour and firmographics, so start by combining your data and building two or three segments that actually work. A buying decision typically involves between 6 and 10 stakeholders, which is why company size alone is not enough. Below you will find the steps, data sources and KPIs you can rely on.
In brief:
- Start with a single product or market and 5–7 variables, and only expand the model once your first segments are delivering measurable results.
- Collect only the signals that matter to the buying decision, from your CRM, accounting system, website and sales notes; a large volume of data does not in itself guarantee insight or better decisions.
- Preparation can take a few weeks if your data is already joined up, but allow 3–6 months from the start of work for the whole rollout and evaluation process.
- For each segment, track margin, conversions, acquisition cost, customer lifetime value and repeat orders, and review segment boundaries every quarter in light of results and changing needs.
- Bring in artificial intelligence for personalisation only once you have good-quality data and a person to check the output; until then, use content and email templates tailored to each segment.
Contents
- How does B2B customer segmentation differ from B2C?
- Which segmentation bases and methods should you choose?
- What data should you collect and how should you prepare it for segmentation?
- How to segment customers: four steps over 3–6 months
- How do you measure segmentation success?
- Is “segment-of-one” personalisation worth pursuing in B2B?
- How segment results reach day-to-day work: from data gateway to automated reports
- What mistakes should you avoid when segmenting B2B customers?
- How do you take diversity and inclusion into account when segmenting B2B customers?
- How does segmentation affect customer retention and loyalty?
- What does segmentation look like in practice: manufacturing and services examples
- Editor’s view: where to start over the next 6–12 months
- How do automated reports and Power BI help sustain segmentation?
- FAQ
- Sources
How does B2B customer segmentation differ from B2C?
In B2B, segmentation means dividing your business customers into groups according to what they actually expect from you and how they behave, not just according to what kind of companies they are. The aim is clear: to speak to each group more precisely, avoid wasting the marketing budget and the sales team’s time, and see return on investment at segment level.
A B2C buyer usually decides alone and within a short time. B2B buying is different: the decision is made by a buying group that includes the finance director, a technical specialist, the end user and the final approver. Each of them has their own concerns and criteria. Cycles are long, so a single message to the whole group rarely works, and communication has to accompany them consistently over several months.
Firmographic indicators, such as industry or headcount, are a natural starting point. Yet many companies go wrong by relying on firmographic data alone, whereas successful segmentation combines firmographics with buyers’ needs and behaviour. Two manufacturing companies of the same size may buy for entirely different reasons: one wants the lowest price, the other predictable supply.
It is also important to remember that segmentation is not a one-off project. A literature review describes it as an ongoing process that needs to be reviewed periodically, because customer needs and the market change.
Which segmentation bases and methods should you choose?
The choice is easier to manage if you sort your variables into layers first and only then pick an analysis technique.
- Firmographic variables: industry, company size, geographic reach, growth stage. They are the easiest to obtain from company registers and the CRM, so they are suitable for a first, rough split.
- Needs-based approach: you ask what problem the customer is solving and what “good service” means to them. Include the whole value chain: effective segmentation considers not only the direct customer but also the needs of that customer’s own customers.
- Behavioural variables: purchase frequency and basket size, product usage data, website and email activity. Digital channels matter here, because a study in Poland and Germany showed that buyers’ information needs, sources and mobility requirements differ, so segmentation remains necessary in the digital environment too.
- Technographic variables: the systems in use, integration requirements, installed equipment base. These are particularly useful when you sell a solution that has to fit the customer’s environment.
When it comes to statistical techniques, it pays to start with the simplest. K-Means clustering quickly forms groups from numerical variables when you can decide the number of segments in advance. Hierarchical clustering helps you see how customers merge into groups and suits small datasets. Latent class analysis is useful when you want to uncover hidden groups based on responses or behaviour. Network analysis reveals relationships between companies, such as supplier and buyer chains. According to a study of data analytics tools, cluster analysis is well suited to establishing a customer typology and allows resources to be directed towards the most profitable segments.
A practical rule of thumb: if you cannot describe a resulting segment in a single sentence that a sales manager would understand, the model is too complex.
What data should you collect and how should you prepare it for segmentation?
The problem is usually not a lack of data but the fact that it is scattered. The signals needed for segmentation are typically found in several places:
- CRM: contacts, deal history, sales stages and reasons for lost deals;
- ERP and accounting (for example, Rivilė or Finvalda): actual orders, turnover, payment discipline, margin by customer;
- email and website signals: opened emails, pages visited, downloaded material;
- sales team notes: customer motivations and objections that are not recorded in any system.
Each system shows the customer from a different angle, and without joining them up a segment remains half-blind. According to a study on implementing segmentation in companies, companies often have plenty of data but are unable to bring it together from the CRM, ERP and accounting systems, so the main investment should be in combining these silos into a single analytical model. Technically, this means data flows from the sources through an ETL process and a data gateway; we described how this works in practice in our article on the Power BI data gateway.
Quality matters more than quantity. A digital commerce review points out that data volume does not produce insight on its own: what matters is whether the data is relevant to the business question. Similarly, a profiling study recommends selective data collection and a clear governance policy. Collect only the signals that relate to the buying decision.
Pro tip: start with a single product or market and 5–7 variables, then expand the working model iteratively.
How to segment customers: four steps over 3–6 months
The literature review proposes a four-stage process. In practice, it can be broken down as follows:
- Preparation (pre-segmentation). Define the objective, for example increasing repeat orders among mid-sized manufacturers. Write down your hypotheses about how customers differ and draw up a data inventory: what already exists, where it is held and who is responsible for it.
- Segmentation. Select the variables, run your chosen model and write a short profile for each segment: who they are, what they want, how they buy and what they are worth. Discard segments that are too small or that you cannot reach.
- Implementation. Tailor channels and content to each segment, and carry the segment tags over into the CRM so that sales managers see them every day. Align messaging with the marketing and sales teams.
- Evaluation. Track KPIs, run A/B tests, gather feedback from the sales team and review segment boundaries every quarter.
Realistically, the first two steps can be completed within a few weeks if the data is already joined up. Implementation and evaluation take longer, because working habits have to change.
How do you measure segmentation success?
Segmentation has to pay for itself, so choose from the outset the metrics you will track for each segment:
- the segment’s revenue potential and margin;
- the change in conversions since segmentation began;
- customer acquisition cost (CAC) by segment;
- customer lifetime value (CLV);
- the share of repeat orders and the length of the sales cycle.
The figures are complemented by qualitative assessment. An experiment with a control group shows causality, while sales managers’ notes explain why the result is what it is. You can also assess how much each segment matters to sales using ABC analysis, which we described in our article on ABC analysis in Power BI.
An illustrative example, not market data: suppose the campaign costs exceed the gross margin earned on the segment’s additional revenue, so the campaign has not paid off. That means you should either cut costs, increase sales or choose a segment with a higher margin.
Is “segment-of-one” personalisation worth pursuing in B2B?
In most cases it is worth reaching segment level first and treating one-to-one personalisation as an additional layer. Only a small proportion of B2B organisations are able to deliver highly personalised marketing content, but most of those that do report a growing market share.
AI-driven personalisation can improve engagement. An email campaign experiment described in a master’s thesis found a higher email open rate. However, this is the result of a single small study, so do not rush to draw broad conclusions.
Where to invest first: in content templates by segment, dynamic campaigns and email personalisation. Bring in artificial intelligence once you have enough clean data and someone to check the output.
How segment results reach day-to-day work: from data gateway to automated reports
A typical flow looks like this: CRM and ERP data goes into an ETL process or data gateway, from there into a BI model, and from the model into automated reports. For example, we described how to turn CRM data into analytics in our guide to CRM and Power BI integration.
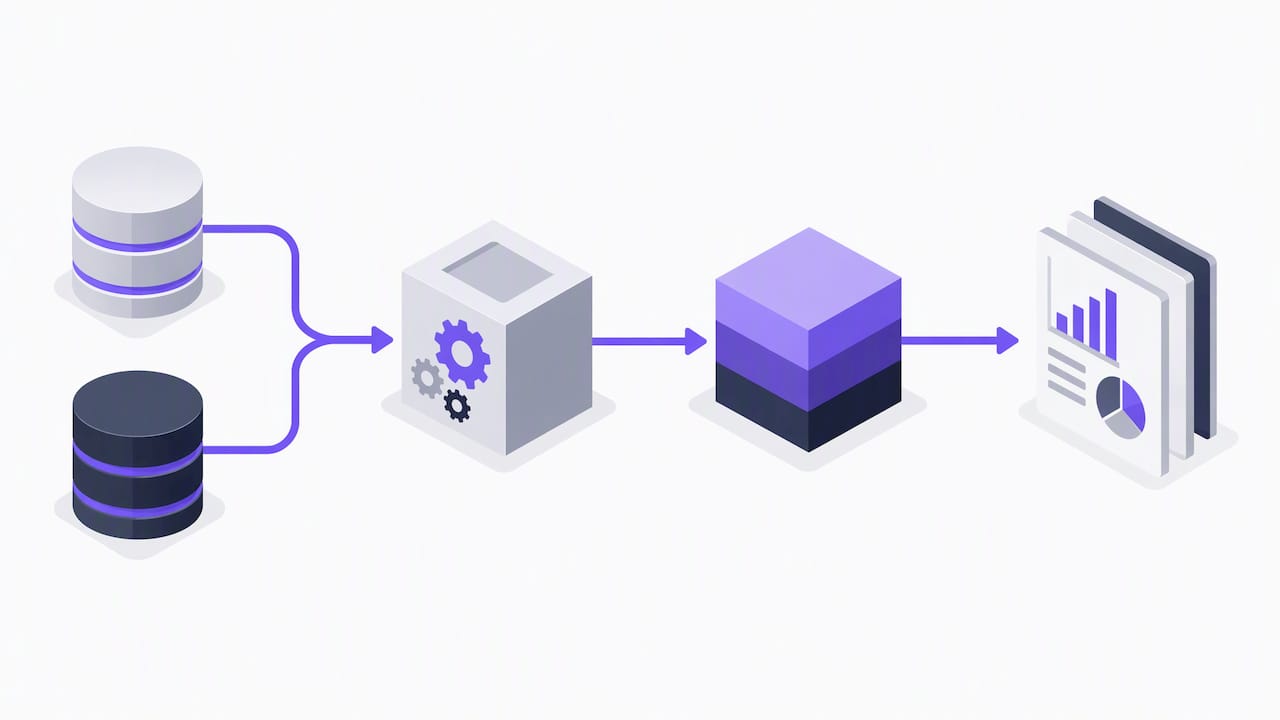
A well-configured report refreshes itself, so in the morning a sales manager can see which segment grew, which customer cut back on orders and who is due a call. Marketing, in turn, can see which campaign reached which segment.
Do not forget security. Segment data contains commercial and personal information, so access rights should be restricted by role, and the data storage location and GDPR compliance should be discussed in advance. You can read more about data storage in our article on the Power BI data warehouse.
What mistakes should you avoid when segmenting B2B customers?
The most common mistakes stem not from complex maths but from how the work is organised.
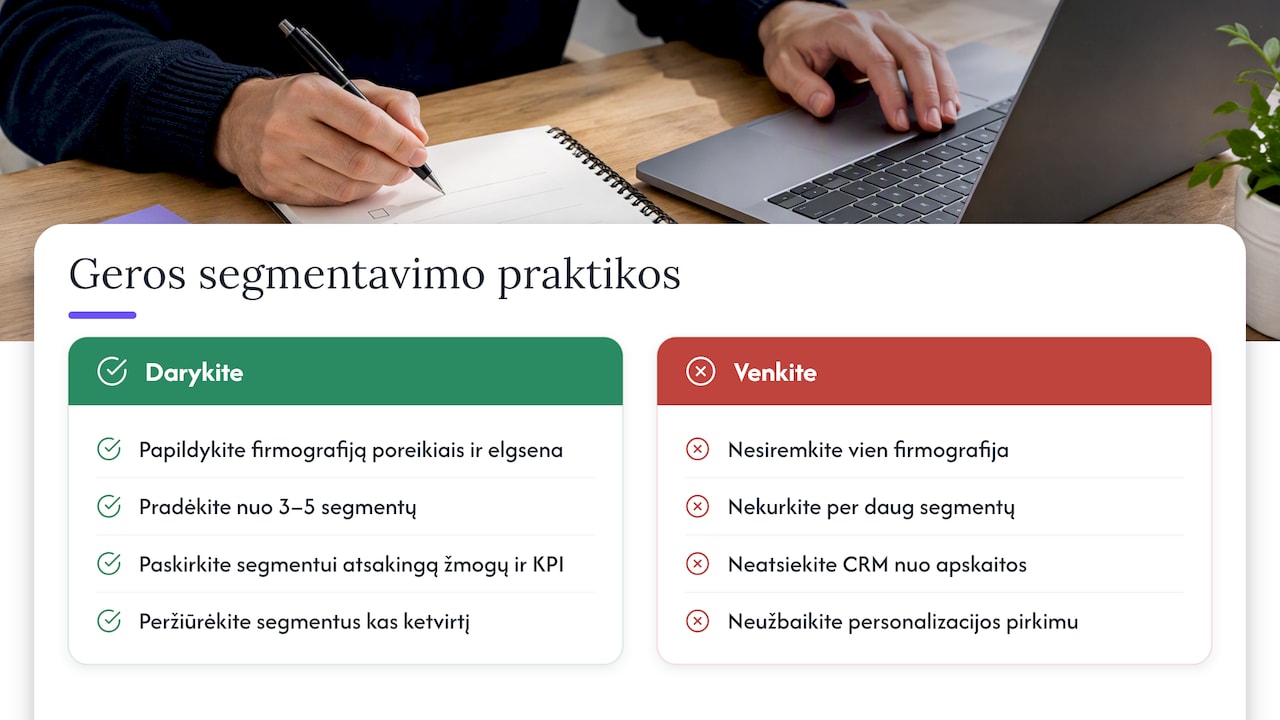
Firmographics only. Industry and size tell you who the customer is, but not why they buy. Supplement them with needs and behaviour.
Too many segments. If there are too many segments, the team may struggle to remember them. Start with three to five for which you can genuinely prepare a separate offer.
Data silos. If the CRM and accounting system are not linked, a sales manager sees the sales history but not the payment discipline. The study on implementing segmentation showed that companies often lack consistency, a strategic choice of target segments and monitoring.
Personalisation that stops at the purchase. A Forrester report shows that personalisation is applied more often during the buying stages, and drops off sharply after the purchase. It is worth accompanying a segment throughout the entire customer lifecycle.
A segment without an owner. If nobody is responsible for a segment’s results, it becomes just another slide. Assign each segment a responsible person and KPIs.
A one-off project. The market moves, so review your segments at least once a quarter.
How do you take diversity and inclusion into account when segmenting B2B customers?
Segmentation can unintentionally leave some customers out of your offers. If you group customers by turnover alone, small family businesses, businesses led by women or minorities, and local suppliers may consistently be assigned to the “low value” group, even though their growth potential is high.
A few practical steps. First, check whether your criteria conceal any bias: are small-order customers really less valuable, or are they simply young companies? Second, take different ways of buying into account: some want personal contact, others self-service. McKinsey research shows that buyers use around 10 interaction channels, and according to the “rule of thirds”, a third want in-person contact, a third remote contact and a third self-service. Third, a buying group is made up of different people, so the language, examples and formats of your messages must be understandable not only to the director but also to the technical specialist.
A review of this kind is not only fairer but also good for business: missed segments are missed revenue.
How does segmentation affect customer retention and loyalty?
Segmentation is often associated with winning new customers, but much of its value lies in retaining existing ones. When you know which customers deserve more attention, you can direct your service levels to where they will pay off.
In practice, this can mean different scenarios: strategic customers get a dedicated account manager and regular meetings, mid-sized customers get automated reminders and offers based on previous orders, and small customers get self-service and a knowledge base. Behavioural signals help you spot risk early: falling order frequency, late payments, fewer logins.
Here we return to Forrester’s observation: personalisation weakens after the sale, even though that is precisely when loyalty is formed. It is worth investing in a data strategy that accompanies the customer through the entire lifecycle, not just up to the signing of the contract.
What does segmentation look like in practice: manufacturing and services examples
The following are illustrative scenarios, not case studies of specific companies.
Manufacturing. A supplier of metal components extracts order history from its ERP and groups customers according to what they value. The first group buys in large volumes and looks for the lowest price, the second frequently orders small batches and values on-time delivery, and the third buys bespoke products and values technical advice. The second group is offered a guaranteed delivery window, the third an engineer’s consultation. Campaigns no longer force everyone to receive the same discounts.
Services. An accounting services firm groups its clients by business complexity and behaviour. It offers micro-businesses a standard package and self-service reports, growing companies additional financial analysis services, and clients with complex structures a bespoke solution. The “growing companies” segment becomes the core one, as it offers the greatest scope for additional sales.
What both cases have in common is that the data is joined up first, before segmentation, and segment tags are fed back into the everyday systems.
Editor’s view: where to start over the next 6–12 months
In our view, many teams start at the wrong end: they buy a platform or build a model while their data is still scattered. Focus first on joining up your data and on two or three segments you can realistically serve. Then move on to measurement and refinement. Leave complex AI layers until the foundations are working.
The biggest risk lies not in the technology but in the people. If marketing and sales disagree about the segments or work from different figures, even the best model will never be put into practice. Sit down together, agree on definitions and review the results every quarter.
— Analitika360
How do automated reports and Power BI help sustain segmentation?
Segmentation only works when the figures reach people on time. We have built Power BI report packages for Rivilė and Finvalda users that combine accounting data with other sources and refresh without manual work. As a result, segment metrics reach managers and the sales team without any extra exports.
- Automated reports with real-time revenue, cost and profit figures.
- Integrations with Rivilė, Finvalda, SharePoint, Excel and CRM data.
- Less time spent preparing reports and faster decisions.
You will find our offers and prices on the business analytics pricing page; for example, the Rivilė Basic and Finvalda Basic plans cost €59 a month each, and the PRO plans €89 a month each. You can also browse our no-manual-work report packages or get in touch with us, and together we will discuss how to support your segmentation work.
FAQ
What is B2B customer segmentation?
It is the grouping of business customers by similar needs, behaviour and company characteristics. This lets you tailor your offer, messaging and service to each group.
How many segments are enough to start with?
Three to five segments for which you can prepare separate offers are enough to begin with. Add more only once the first ones are working and have been measured.
What data do you need for segmentation?
The foundation is CRM, ERP and accounting data, supplemented by email and website signals. It matters more that the data relates to the buying decision and is combined into a single model than that there is a lot of it.
Does segmentation require artificial intelligence?
Not necessarily. You can start with simple clustering and clear firmographic and behavioural criteria. It is worth bringing in artificial intelligence later, once you have enough good-quality data.
How often should segments be reviewed?
Segmentation is an ongoing process, so it is advisable to review segments at least once a quarter. That way you will spot changes in needs and behaviour before they show up in sales.
Sources
- LinkedIn marketing VP: Understanding ‘complexity’ of B2B buyers is key to growth
- A systematic review and research agenda
- The State Of B2B Personalization, 2024 | Forrester