See more. Decide better.
 Cost analytics: where the money really goes

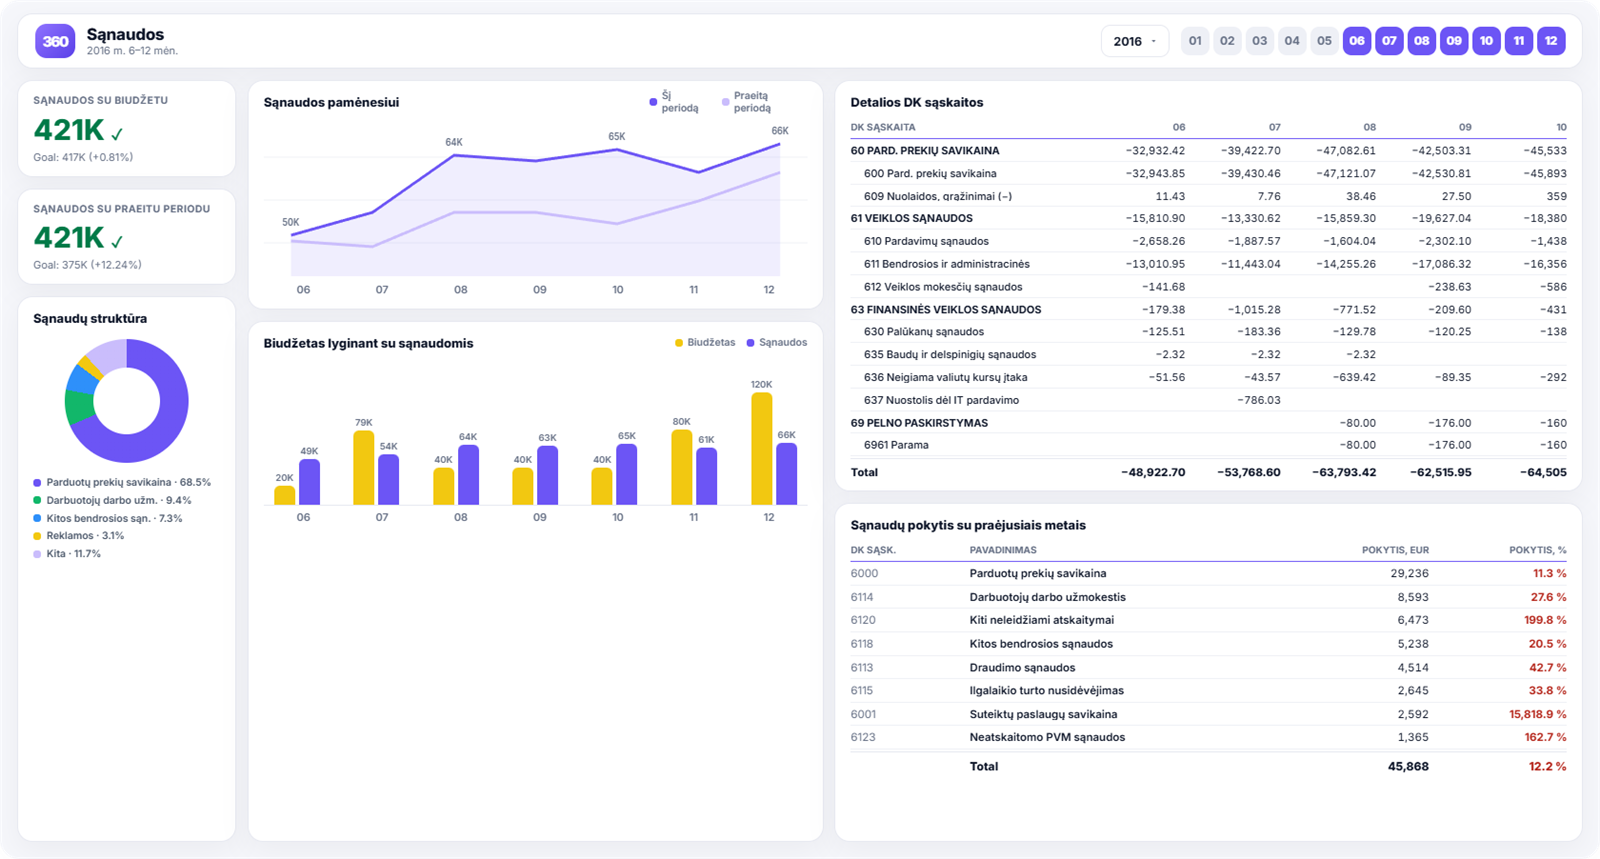
Most companies keep a close eye on revenue. Costs often take a back seat, until it turns out that profit has fallen even though turnover has grown. The cost report shows spending month by month and year to date, its structure and how it compares with budget and the previous year.
What decisions it helps you make
- Which costs are growing faster than revenue. This is the first sign that profitability will shrink, even if turnover looks healthy.
- Whether you are sticking to budget. Variances are visible month by month, so you can react during the year rather than after it.
- Where to look for savings. The cost structure shows which categories make up the bulk of spending, and they are often not the ones we instinctively suspect.
- Whether a one-off expense is distorting the result. Drilling down to account level lets you separate one-off events from the underlying trend.
What you see in the report
- costs by month and cumulatively;
- comparison with budget and with the previous period;
- cost structure by category (cost of goods sold, payroll, advertising, other);
- detailed general ledger accounts, broken down to sub-accounts;
- the change in costs compared with last year, in euros and as a percentage.
How to read this report
The most useful view is not the absolute amount but the percentage change compared with last year. If general and administrative expenses are up 28% while revenue is up 14%, the problem is obvious at once, even though neither figure looks alarming on its own.
The second thing worth watching is cost categories whose share of the overall structure is shifting. A category that grows steadily often means that some process is quietly becoming more expensive.
Fixed and variable costs
One view that is often missing from standard reports is the split of costs into fixed and variable.
Variable costs (cost of sales, transport, packaging) should rise in line with turnover, and that is normal. Fixed costs (rent, administration, licences) should not rise unless something has been changed deliberately.
The practical benefit is simple: if turnover falls while fixed costs stay the same, you know how long you have before you make a loss. Every manager should know this figure by heart.
A practical example
The most common finding we see after setting up this report looks like this: total costs are growing “normally”, at 8–10% a year, and nobody suspects anything.
Once broken down by category, it turns out that one line, often transport, packaging or IT subscriptions, has grown by a third over the same period. It disappears in the total because it makes up only a small share. On its own, it is a conversation to have with the supplier.
The second common case is costs that “have always been like that”, because a few years ago someone ordered a service that nobody uses any more. Drilling down to account level brings such lines to light within minutes.
What to do with the result
The cost report is only useful when every major category has an owner: a person who can explain how it has changed. In practice, it is enough to review it once a month alongside the revenue report: revenue growth without cost growth is one thing, while both growing together is quite another.
You can see the overall result that all this adds up to in the profit analysis.
How to get this report
Cost analytics is included in the ready-built report packages for Rivilė and Finvalda users. The reports refresh automatically, and prices start from €59 a month; find out more on the pricing page.