See more. Decide better.
 Revenue analytics: what the report shows and which decisions it helps you make

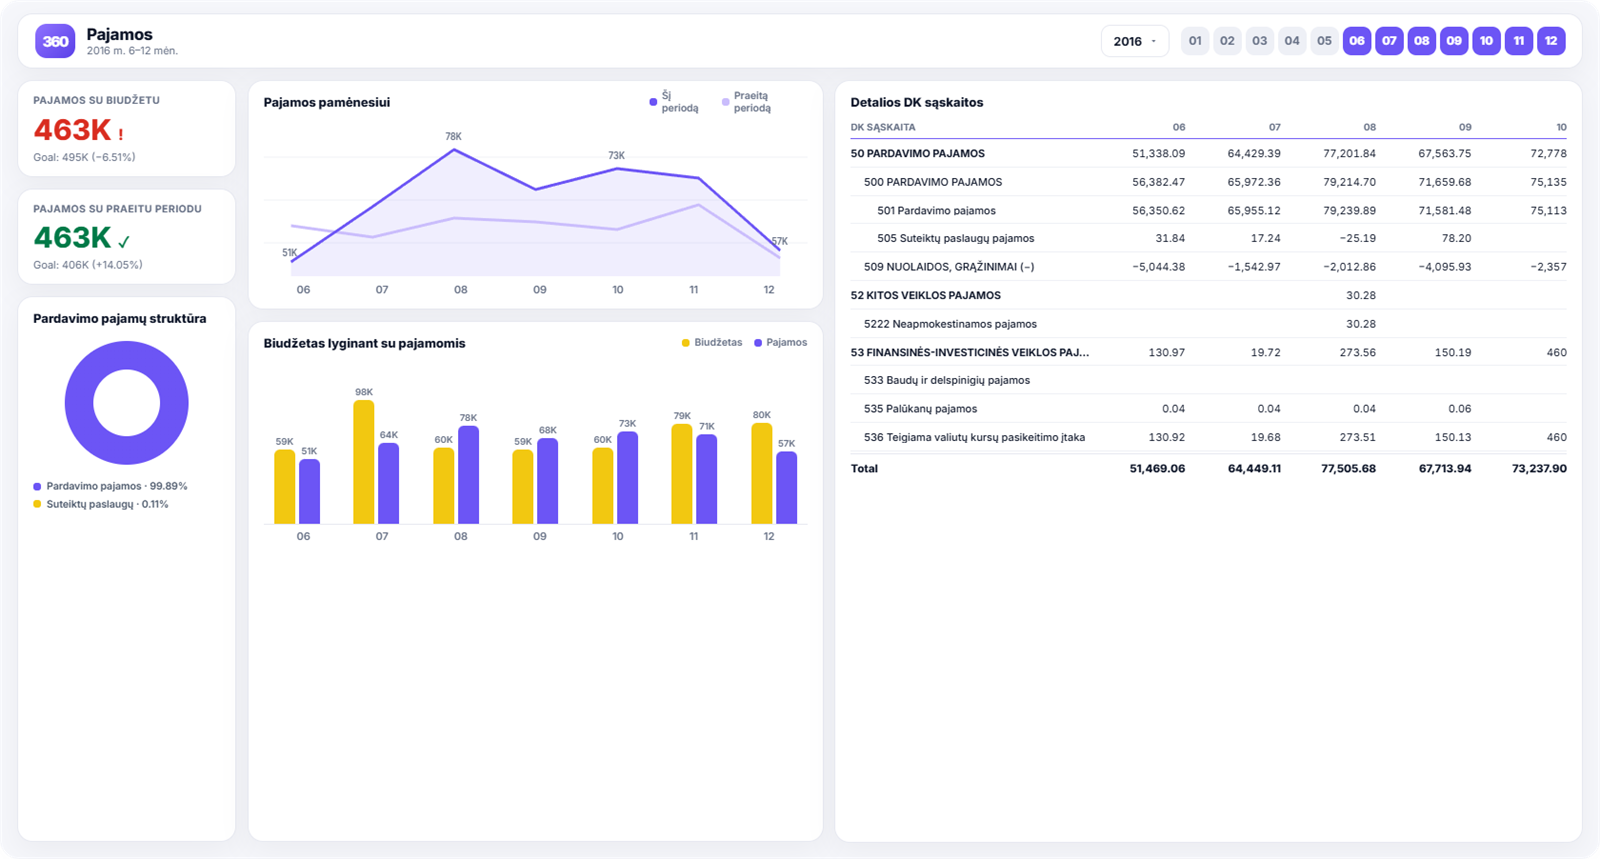
The revenue report answers a question that seems simple but rarely has a quick answer: did we earn more this month than we planned, and more than last year? The report shows revenue month by month and cumulatively, setting it against the same period last year and against the budget.
Which decisions it helps you make
- Is the sales plan on track? A monthly comparison with the budget shows any variance straight away, not a quarter later.
- Where has the growth gone? If revenue has fallen, drilling down to the general ledger accounts shows which type of revenue has shrunk.
- How does seasonality play out? Several years of monthly data on a single axis let you plan inventory and staffing around the actual season rather than a guessed one.
- Is it worth changing your pricing? Seeing the revenue mix lets you judge which product or service groups genuinely bring in the money.
What you see in the report
- revenue by month and cumulatively (year to date);
- comparison with the same period last year;
- comparison with the budget and the variance as a percentage;
- sales revenue broken down by revenue type;
- detailed general ledger accounts, with the option to break any total down into its underlying accounts;
- filters by period, department and other attributes.
How to read this report
Start with the headline figures — revenue against budget and against the previous period. If both are green, there is no need to dig deeper. If one is red, go to the monthly chart and find the month in which the variance began, then to the general ledger account table to see which specific revenue line has changed.
This path from the overall figure to a specific account takes a few seconds and usually shifts the conversation in the meeting from „revenue has fallen” to „revenue fell because of one product group in June”.
Revenue is not cash
An important distinction that causes the most misunderstandings: revenue is recorded when the invoice is issued, not when the money arrives.
So a good revenue month and an empty bank account can coincide without any error in the accounts — the money is simply still with your customers. How much of it there is, and how long it has been outstanding, is shown by the debt analytics and the late payments report.
The practical conclusion: it is worth reading the revenue report alongside receivables. Growing revenue combined with receivables growing even faster means that you are the one financing the growth.
Comparing with the budget is only useful when the budget is realistic
The budget variance column is the most valuable element of the report — and the one most often ignored, because the budget was drawn up once at the start of the year and no longer reflects reality.
A few practical rules that change this:
- The budget is phased by month, not divided by twelve. Seasonality has to be built into it, otherwise half the year will show a „variance” that doesn’t exist.
- It is reviewed every quarter. Not rewritten, but checked — are the assumptions still valid?
- It has an owner. A variance has to be explained by a person, not by the report.
If there is no budget, the same period last year stands in for it temporarily — the report always includes that comparison.
Seasonality as a planning tool
Several years of monthly data on a single axis quickly show which months are strong in your business and which are weak every year.
This changes two decisions. First, inventory and staff planning is based on real data rather than gut feeling. Second, a weak month stops looking like a crisis — if it is weak every year, that is the calendar, not the market.
A more detailed view of changes by individual account is provided by the variance analysis, and the overall result by the profit analysis.
How to get this report
Revenue analytics is included in the ready-built report packages for Rivilė and Finvalda users — the data is taken directly from the accounting system and refreshes automatically. Prices start from €59 a month; you will find the full comparison on the pricing page.