Your business in 360°
Rivilė API and Power BI: how to connect your data for reporting

Rivile ERP data reaches Power BI through an API built for analytics: Power BI sends a GET https://api.rivile.cloud/bi/collect request with the API key in the header and receives sales, purchasing, inventory, debt or general ledger data. Connecting is quick, but a report model that refreshes every day without errors needs pagination, incremental refresh and a well-organised data structure. That is why, for companies that want reliable day-to-day metrics rather than a technical experiment, Analitika360 offers ready-built Rivilė Power BI packages: Basic at €59 a month and PRO at €89 a month, with automatic refresh and no extra work for the user.
In brief
- The Rivile ERP analytics API returns data sources such as sales and purchase invoice lines, inventory balances, debts, general ledger entries and payments.
- Every request needs an API key, passed in the “X-SessionToken” header.
- A single GET response returns up to 100 records, so pagination is essential for larger volumes.
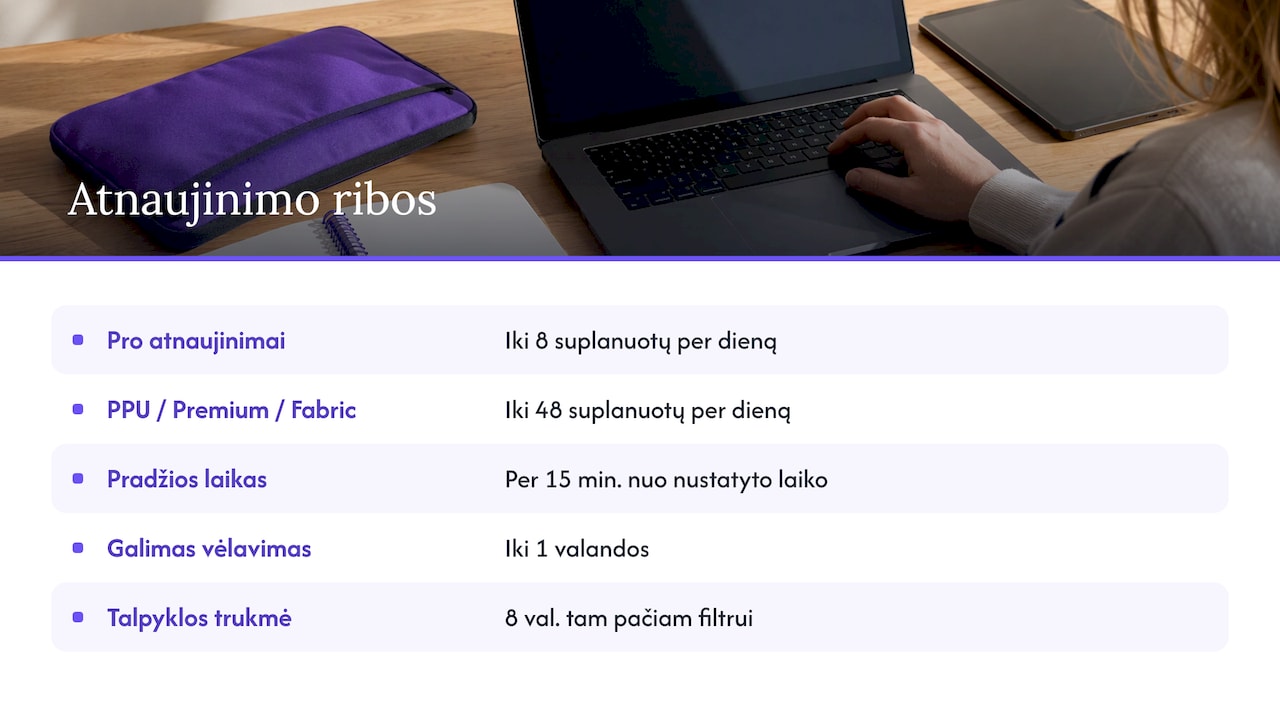
- Power BI Pro allows up to 8 scheduled refreshes a day; Premium Per User and capacity licences allow up to 48.
- A ready-built Analitika360 package takes over these steps and delivers working revenue, expenses, profit, debt and warehouse reports.
Contents
- What the Rivilė API gives Power BI
- What you need before connecting
- Connecting step by step
- Refresh: how often, and why data can lag
- Which reports to build from Rivilė data
- Data security
- Our view
- Ready-built Rivilė Power BI packages
- FAQ
- Sources
What the Rivilė API gives Power BI
An API (application programming interface) is the route by which one program automatically fetches data from another, without manual exports to Excel. Rivile ERP has a separate endpoint dedicated to analytics, and the Rivile ERP analytics guide lists the most commonly used data sources:
| Data source | What it contains | What it is useful for |
|---|---|---|
| SALES_INVOICE_DETAILED | Sales invoice lines | Revenue, margin, product and customer analysis |
| PURCHASE_INVOICE_DETAILED | Purchase invoice lines | Expenses, suppliers, cost of sales |
| INVENTORY_STOCK | Inventory balances | Stock value, out-of-stock items |
| PAYABLE_RECEIVABLES_FLAT | Customer and supplier documents, due dates, balances, payment status | Control of debts and cash flow |
| GENERAL_LEDGER | General ledger entries | Profit and loss statement, balance sheet |
| PAYMENTS | Payments | Collection of receivables |
| CLIENT, CLIENT_GROUP, PRODUCT, PRICE | Customers, customer groups, products, pricing | Dimensions for filters and segments |
The general Rivile ERP API also serves other integrations: online shops, order and stock-level synchronisation, and document creation. For Power BI reporting, though, the key endpoint is the analytics one, /bi/collect.
If a company uses Rivilė GAMA, installed on a computer or server, data usually travels to Power BI by a different route, through a copy of the database. We cover this in more detail in our article on Rivilė data replication.
What you need before connecting
- An API key. It is created in Rivile ERP by a user with the necessary permissions. Under the API usage rules, every request must include the “X-SessionToken” header containing the key. How the key is created, and why it is worth saving straight away, is explained in our guide Rivilė, Excel and Power BI.
- Well-considered permissions. Rivile ERP permission groups let you restrict access to modules (Sales, Purchases, Warehouse, Inventory, Reports) and block, for example, viewing of financial data. Read-only permissions are enough for a user dedicated to reporting.
- Power BI Desktop and licences. Reports are built in the free Power BI Desktop application, but to publish them and share them with colleagues you need a Power BI Pro licence. Analitika360 resells Microsoft Pro and Premium licences, so you can order them together with the reports.
- Awareness of the limits. A GET request returns up to 100 records, POST and PUT requests are limited to 5 MB, and a response is awaited for no more than 5 minutes.
Connecting step by step
The sequence described in the Rivile ERP guide is as follows. For each step we note where problems most often arise.
- Create parameters. In the “Manage Parameters” window in Power BI Desktop, create BaseUrl = “https://api.rivile.cloud”, ApiKey, FromDate and ToDate. Common mistake: the key is typed straight into the query text, where it stays visible to anyone who receives the .pbix file.
- Choose a connector. Use Get Data > Web or “Blank Query” and write the query in M (the Power Query formula language). Common mistake: a simple Web connector without parameters makes it impossible to change the period or data type later.
- Build the request. The address is made up of /bi/collect, the type parameter (e.g. SALES_INVOICE_DETAILED) and a filter, while the key is passed in the X-SessionToken header. In outline:
let
    Saltinis = Json.Document(Web.Contents(BaseUrl, [
        RelativePath = "bi/collect",
        Query = [type = "SALES_INVOICE_DETAILED"],
        Headers = [#"X-SessionToken" = ApiKey]
    ])),
    Duomenys = Saltinis[success][data],
    Lentele = Table.FromRecords(Duomenys)
in
Lentele- Extract the data. Take the success.data array from the response and convert it into a table. Common mistake: only the first response is taken, and since it holds up to 100 records, a year’s sales look like a few days’ worth. You need a function that loops through and collects every page.
- Lay out the model. The guide recommends a star schema: fact tables (invoice lines, general ledger entries) in the centre and dimensions (customers, products, dates) around them. Common mistake: everything is merged into one wide table, the model balloons and figures start to duplicate.
- Enable incremental refresh. Based on a date column, such as the document date, Power BI refreshes only the latest period each time rather than the entire history.
In Analitika360’s Rivilė packages these steps are already done: Rivilė data is combined into a single Power BI model, reports refresh automatically and, where needed, SharePoint, Excel, CRM or logistics data can be connected to the same model.
Refresh: how often, and why data can lag
According to Microsoft Learn’s description of scheduled refresh, Power BI Pro allows up to 8 scheduled refreshes a day, while Premium Per User, Premium and Fabric capacity allow up to 48. A refresh starts within 15 minutes of the scheduled time but can be delayed by up to an hour. If nobody opens a report for two months, its scheduled refresh is paused.
On the Rivilė side, the cache matters: a repeat request with the same filter is served from the cache for 8 hours rather than from the live database. In practice this means the filter and the refresh time have to be aligned, otherwise a manager sees yesterday’s figures in the morning. The Rivile ERP guide also advises scheduling data extraction overnight.
Another frequent obstacle is model size. On a Pro licence it is capped at 1 GB, and when you try to publish a larger model Power BI returns the error “(400) Bad Request”. A Premium Per User licence or Premium capacity solves this, but more often a tidy star schema and only the columns you actually need are enough.
Which reports to build from Rivilė data
The same API data sources deliver different value to different users:
- Restaurant owners: revenue by day, week and outlet, food costs from purchase invoices, gross margin and stock levels. A restaurant chain needs to see all its outlets on one screen.
- Accountants: customer and supplier debts by due date, payment status, general ledger turnover. We show how this saves time every week in our article on Rivilė debt control, and at year end Rivilė balance sheet analysis will come in handy.
- Finance managers: a monthly profit and loss statement, cost structure, and budget versus actual when the budget is kept in an Excel or SharePoint file.
- Small business owners and consultants: a handful of key metrics, namely revenue, expenses, profit and debts, which refresh without manual work and can be viewed on a phone.
For sales there is a dedicated Rivilė sales analysis, and for the warehouse, Rivilė warehouse reports.
Data security
The Rivile ERP guide stresses that API keys must be kept secret and that the data retrieved should be stored securely within your own infrastructure. On the Power BI side, the other key question is who sees what: an outlet manager should not see other outlets or the profit of the company as a whole. This is handled by row-level security, where the same report shows each user only the data they are permitted to see. Analitika360 ensures data security in its solutions, and for IT managers we have prepared Power BI security steps.
Our view
The Rivile ERP analytics API is a good foundation: data is available through a single address, with clearly named data sources. Even so, what creates value for a manager is not the connection itself but a model that can be trusted every morning.
That is why we build ready-made report sets for Rivilė users. Data retrieval, model structure and automatic refresh are already sorted, and revenue, expenses, profit, the balance sheet, sales, the warehouse and debts can all be seen in one place. Where a company has its own processes, such as the outlets of a restaurant chain, or logistics or construction project data, we tailor the solution to its systems.
In our view, a finance team’s time is best spent not on fixing queries but on the decisions that accurate figures help them make.
Analitika360
Ready-built Rivilė Power BI packages
If you want to see your Rivilė data in Power BI without writing API queries, choose a ready-built package. Rivilė Basic costs €59 a month and Rivilė PRO €89 a month. For specific reports and integrations with other sources we carry out bespoke projects at €70 an hour, and the Microsoft Pro and Premium licences you need can be ordered at the same time.
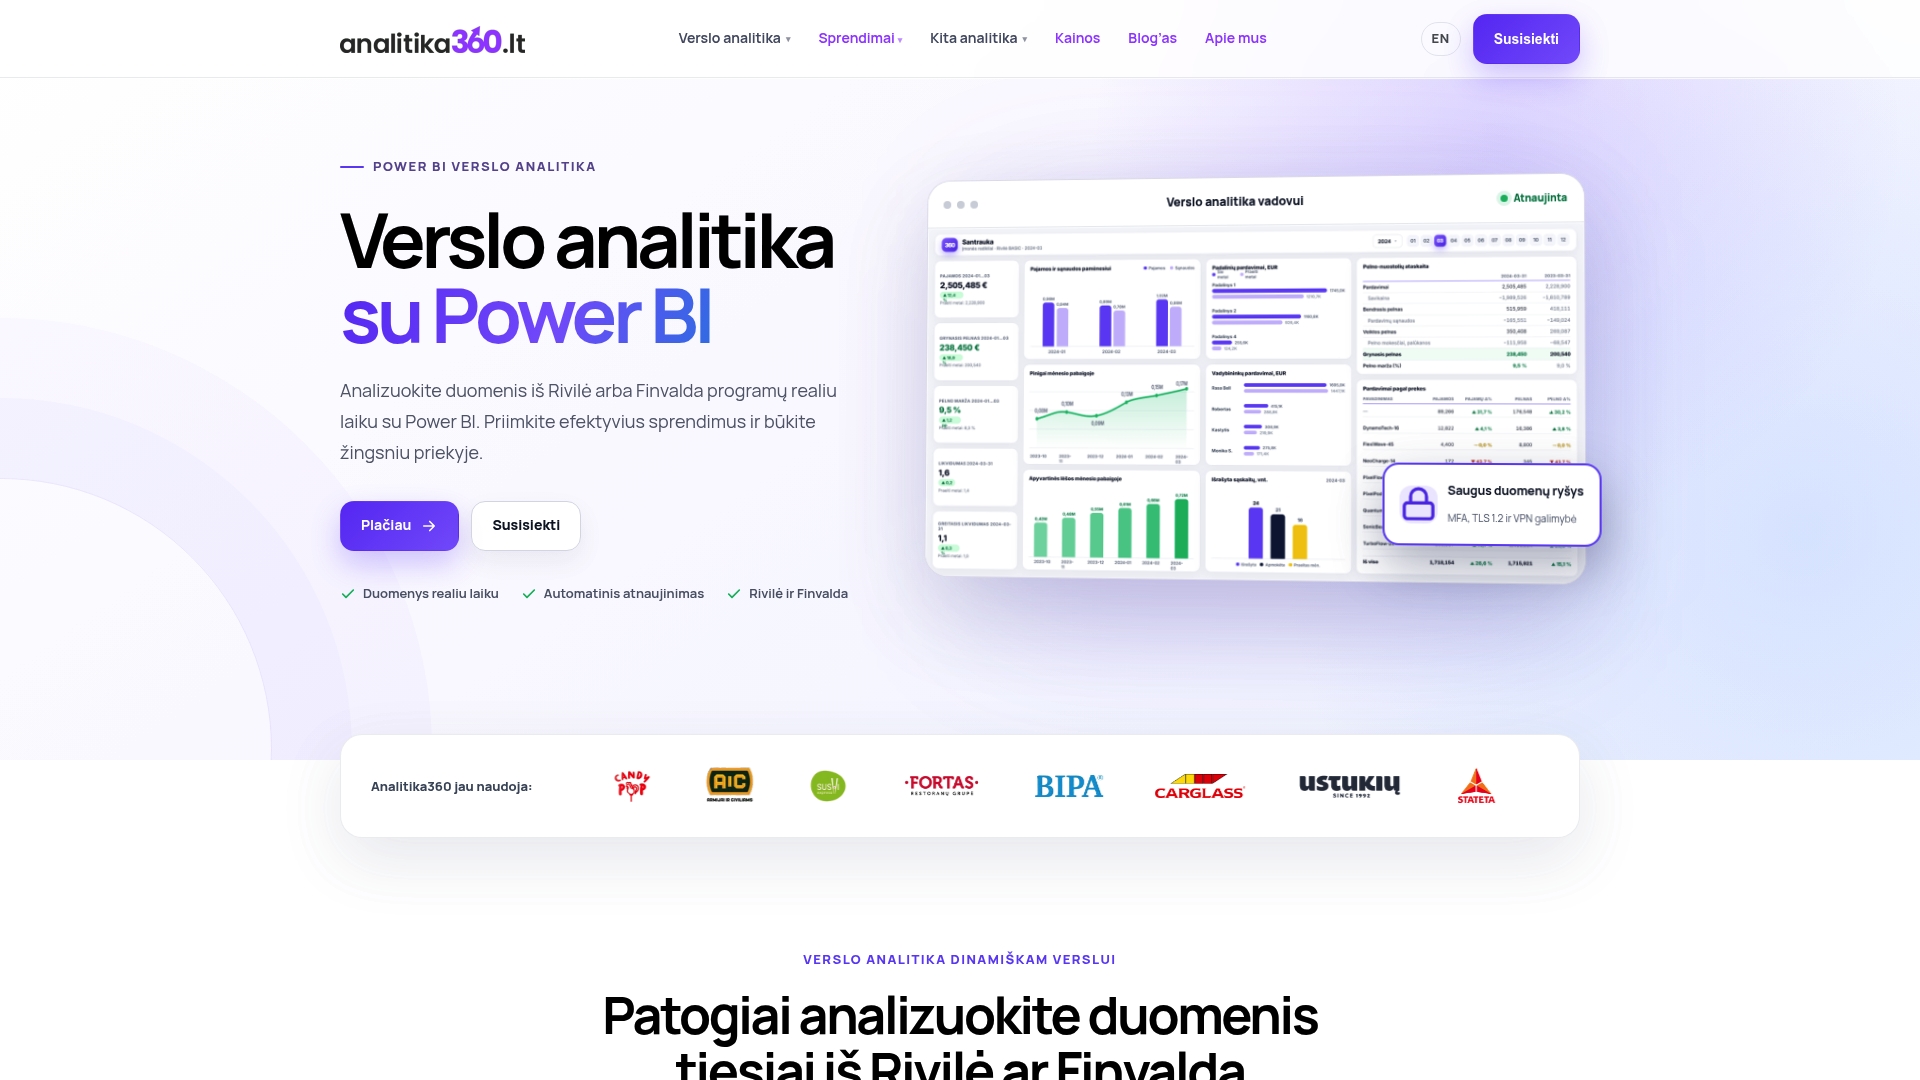
You will find all prices and a comparison of the packages on our business analytics pricing page.
FAQ
Does the Rivilė API work with Rivilė GAMA?
The /bi/collect analytics endpoint described in this article belongs to the Rivile ERP cloud system. Rivilė GAMA data is usually transferred to Power BI through database replication. We describe this route in detail in our article on Rivilė and Finvalda data replication.
Why does Power BI show only 100 rows?
The Rivile ERP API returns up to 100 records in a single GET response. To get all your data, the Power Query query has to loop through and collect every page. In Analitika360 packages, reports refresh automatically with no extra work for the user.

How many times a day does a report refresh?
With a Power BI Pro licence you can schedule up to 8 refreshes a day; with a Premium Per User or capacity licence, up to 48. On the Rivilė side, repeat requests with the same filter are served from the cache for 8 hours, so it is worth aligning your refresh times.
Do I have to pay for Power BI licences?
The free Power BI Desktop application is enough for building a report, but publishing and sharing reports requires a Pro licence. Report viewers need no licence only on P1 or higher, or F64 or higher, capacity. Licences can be ordered through Analitika360.
Sources
- Rivile ERP guide: analytics, reporting and data export
- Rivile ERP guide: API
- Rivile ERP guide: ways of using the API
- Rivile ERP guide: users and permission groups
- Microsoft Learn: Configure scheduled refresh
- Microsoft Learn: Troubleshoot Power BI Desktop publishing
- Microsoft: Power BI pricing and licences