See more. Decide better.
 Project Profitability: How to Assess and Improve It in 2026

Project profitability is assessed using discounted cash flows, with NPV and IRR as the main criteria. For short-term or smaller decisions, ROI or the payback period are also used, but these act as a filter, not the final argument. The Ministry of Finance’s recommendations propose a similar approach for public investment projects, using the EGDV (economic net present value) and ENIS (economic benefit-cost ratio) indicators.
In brief:
- Include administrative and shared IT costs in your return on sales and net profitability calculations; if you leave them out, the margin will look higher than it really is.
- A positive NPV shows the value of a long-term project, and the decision is acceptable when IRR exceeds WACC; test changes in revenue, costs and the discount rate with sensitivity analysis.
- For small and short-term projects, ROI or the payback period is enough as an initial filter, but these measures do not account for the time value of money, so they are not suitable for the final decision.
- Before modelling, align how periods are labelled across your accounting, spreadsheet and customer relationship management systems, because mismatched dates distort the forecast even when the right method is used.
- Rivilė Basic and Finvalda Basic cost €59 a month each, while their PRO packages cost €89; bespoke customisation costs €70 an hour.
Contents
- Key profitability measures and formulas
- Discounting and DCF methods: NPV, IRR and PI step by step
- When simpler methods will do: the payback period and ROI
- Data and financial modelling: from collection to a linked structure
- How automated reports help you track project profitability
- Editorial perspective: where things are heading in 2026
- How to automate profitability reporting with Analitika360
- FAQ
- Sources
Key profitability measures and formulas
When assessing a project, finance professionals usually start with a handful of basic measures. These show the overall economic direction but do not answer the question of whether the project is worth starting.
- Return on sales = net profit / sales revenue. Shows how much profit remains from every euro earned.
- Net profitability = net profit / capital invested. Useful when comparing projects with different amounts of funding.
- ROI = (profit earned - cost of investment) / cost of investment. Suitable for a quick, though not necessarily precise, comparison.
- EBITDA margin = EBITDA / revenue. Separates operating efficiency from the effects of tax and depreciation.
The limitation of these measures is that they ignore the time value of money: a euro received today and a euro received in three years’ time count the same, even though in reality their value differs. For long-term projects, therefore, these measures are only suitable for the preliminary screening stage, as noted in this overview of profitability calculation.
Professional tip: when calculating return on sales or net profitability, always include indirect costs such as administrative staff or shared IT expenses; otherwise the margin will look artificially higher than it is in reality.
Discounting and DCF methods: NPV, IRR and PI step by step
Discounted cash flow methods remain the main tool for assessing medium- and long-term projects, because they take into account not only the amount of money but also when it is received.
- Build a cash flow projection for each period: operating cash flows, capital expenditure (CAPEX), changes in working capital and the residual (terminal) value at the end of the project.
- Choose a discount rate. For company projects, the weighted average cost of capital (WACC) is most commonly used; for public or social-benefit projects, a social discount rate applies.
- Discount each period’s cash flow to its present value and add them up: this is the NPV. A positive NPV means the project creates value above the required return; a negative one means it creates no value at the chosen rate.
- Calculate the IRR, the discount rate at which NPV equals zero. When IRR exceeds WACC, the project is considered acceptable.
- Check the PI (profitability index), the ratio of present value to the initial investment, particularly when several projects are competing for a limited budget.
- Carry out sensitivity analysis by changing the key assumptions (revenue growth, discount rate, cost levels) and watching how the NPV changes.
The EIB methodology draws a clear distinction between economic analysis (ENPV, ERR), which assesses the benefit to society, and financial analysis (FNPV, FRR), which reflects the investor’s perspective, and requires sensitivity analysis when deciding on larger investments.
When simpler methods will do: the payback period and ROI
Not every decision calls for a full DCF model. When a project is short or the amount involved is small, simpler measures allow a quicker decision without complex modelling.
- Payback period = initial investment / annual cash flow. Shows how long it takes for the investment to ‘pay for itself’, but does not assess what happens after the payback point.
- Simple ROI is suitable for small, short-term projects where additional discounting would not make a meaningful difference to the conclusion.
- Use these methods as an initial filter, ruling out obviously unpromising projects before investing time in a full DCF analysis.
The problem arises when these measures become the final argument for larger or long-term projects. Practical reviews recommend using them only for initial assessment and basing the final decision on discounted cash flow analysis, because simple measures do not take the time value of money into account.
Data and financial modelling: from collection to a linked structure
The foundation of a sound profitability assessment is not the formula but the quality of the data. Poorly collected or incomplete data distorts every calculation, even when the method has been chosen correctly.
- Gather revenue and cost data: direct costs (materials, labour hours), indirect costs (administration, IT), CAPEX, depreciation and taxes.
- Build a linked three-statement structure: a profit and loss statement, balance sheet and cash flow forecast that update in step with one another when a single assumption is changed.
- Choose a terminal value method to suit the nature of the project: a perpetual growth model for long-term projects, or an exit multiple when the project has a planned end point.
Professional tip: before you start modelling, check that all data from different sources (accounting systems, Excel, CRM) uses the same period logic; otherwise cash flows will be distorted by mismatched dates.
Combining this data by hand from several systems is one of the most common sources of errors, and the practice of preparing a Finvalda profit report shows how structured data preparation reduces this risk.
How automated reports help you track project profitability
The biggest problem we encounter when working with finance teams is not choosing the method but the time it takes to collect the data. When revenue, costs and profit are calculated by hand from different systems, the likelihood of errors grows with every additional source.
- Data from accounting software can be integrated into Power BI models without additional manual exporting.
- Reports can be refreshed automatically, allowing the finance team to work with up-to-date figures.
- The sector-specific report packages on offer can be tailored to different industries, such as restaurant chains or construction companies.
- Data can be combined with SharePoint or Excel sources when the profitability assessment needs wider context.
We describe practical implementation examples on our Rivilė, Finvalda and Power BI integration page, and illustrate cost control logic for project managers in our construction cost management practice.
Editorial perspective: where things are heading in 2026
The biggest mistake we see repeated is relying on a single measure. ROI or the payback period look convenient, but they say nothing about what happens after the first year. The trend we are observing is not a new method but faster data flow: automated integration makes it possible to update DCF models more often, not just once a quarter. EU guidelines continue to strengthen the importance of CBA for larger projects, but in practice a combination works best: a quick filter for screening, a full NPV/IRR model for the decision, and scenario analysis for safety.
— Analitika360
How to automate profitability reporting with Analitika360
We work with companies for which calculating project profitability takes days rather than hours, because the data sits in different systems and Excel files. Power BI report packages can combine accounting data with other sources and show revenue, cost and profit measures in real time, without manual updating.
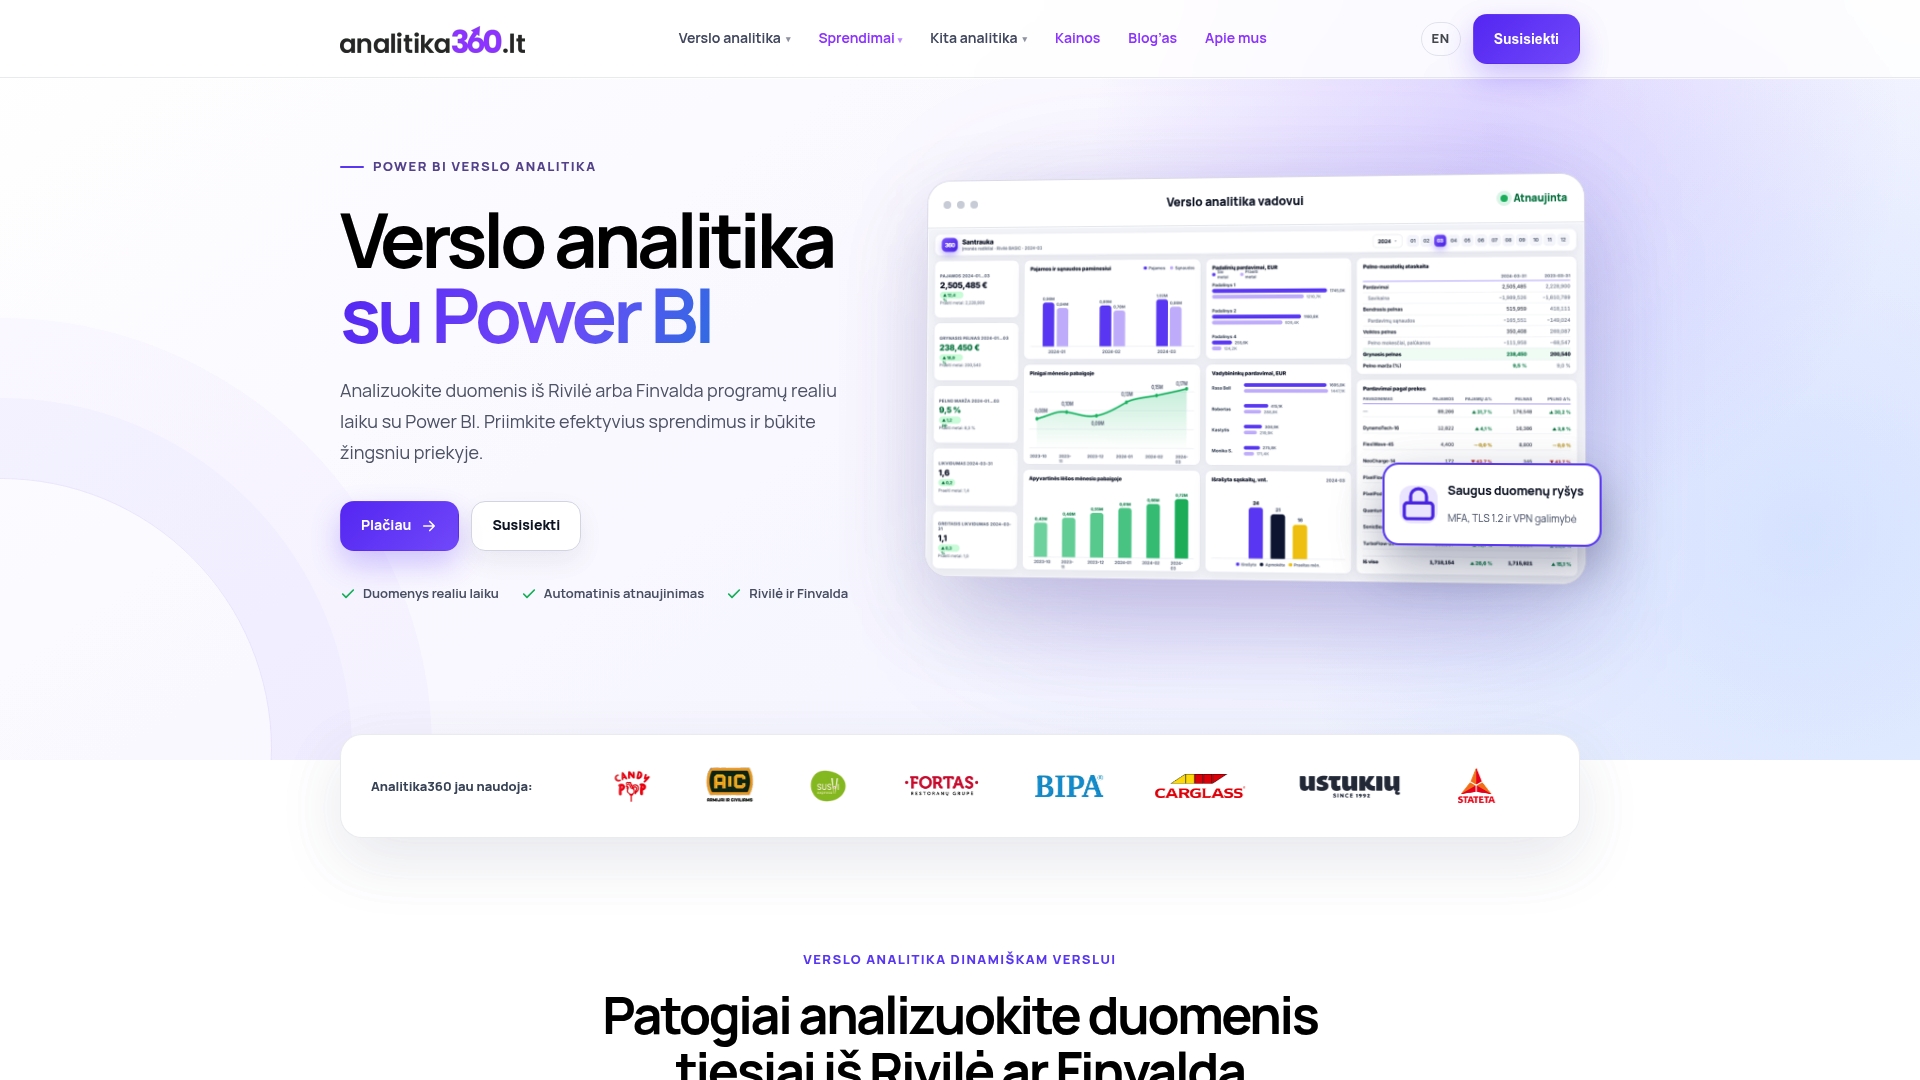
- Rivilė Basic and Finvalda Basic cost €59 a month each and are designed as an entry-level set of automated reports.
- Rivilė PRO and Finvalda PRO cost €89 a month each, with broader integration of measures.
- Bespoke projects cost €70 an hour, for when the model needs to be adapted to specific project structures.
If you would like to see how this works with your own data, take a look at the pricing and bespoke projects page and get in touch to arrange a demo.
FAQ
What is a project profitability measure for finance professionals?
A project profitability measure shows how much value a project creates compared with the amount invested. For long-term projects, NPV and IRR are most commonly used because they account for the time value of money, while for short-term decisions ROI or the payback period are suitable as an initial filter.
How do you calculate NPV and IRR in practice?
NPV is calculated by discounting each period’s cash flow to its present value and adding up the results, while IRR is the discount rate at which NPV equals zero. The EIB methodology recommends supplementing these measures with sensitivity analysis before making the final decision.
When is it worth using the payback period rather than NPV?
The payback period is suitable for small, short-term projects where full discounting would not change the final conclusion. For larger or long-term projects, practical analysis recommends using it only as an initial filter and basing the final decision on NPV or IRR.
What are EGDV and ENIS, and when do they apply?
EGDV (economic net present value) and ENIS (economic benefit-cost ratio) are indicators used to assess the economic viability of public investment projects. According to the Ministry of Finance’s recommendations, a project is considered justified when EGDV is greater than zero and ENIS is greater than one.
How do automated reports help reduce errors when assessing profitability?
Automated reports pull data directly from accounting systems, removing the manual transfer step where errors most often creep in. Our Power BI solutions update revenue, cost and profit measures without any additional user intervention, so the finance team works with more accurate figures.
Sources
- Ministry of Finance of the Republic of Lithuania – recommendations for selecting investment projects
- The Economic Appraisal of Investment Projects at the EIB
- Visasverslas