Your business in 360°
Star Schema in Power BI: Fact and Dimension Tables in Practice

A star schema in a Power BI model means that at its centre sit one or more fact tables holding the numbers (amounts, quantities, transactions), surrounded by dimension tables that you use to filter and group those numbers: date, customer, product, department, account. This is the structure Microsoft recommends, because it gives you simpler DAX formulas, faster reports and a clearer field list for users. Below we explain how to build a star schema from accounting data, how it differs from a snowflake schema and which mistakes are worth avoiding.
In brief
- Dimension tables are for filtering and grouping; fact tables are for summing.
- Fact and dimension tables are linked by a one-to-many relationship: the dimension is on the “one” side and the facts are on the “many” side.
- A snowflake schema splits a single dimension into several normalised tables; in a Power BI model it is usually better to merge them into one.
- For accounting data (revenue, expenses, profit), a good fit is a fact table built from general ledger entries plus the dimensions date, chart of accounts, departments and business partners.
- Avoid unnecessary bi-directional filtering, one-to-one relationships and relationships based on calculated columns.
Contents
- What a star schema is and why it matters in Power BI
- How to relate fact and dimension tables
- A star schema from accounting data: revenue, expenses, profit
- The snowflake schema in Power BI and how it differs
- When to choose a star schema and when a snowflake
- Common modelling mistakes
- Our approach
- Ready-built Power BI reports for Rivilė and Finvalda data
- FAQ
- Sources
What a star schema is and why it matters in Power BI
The star schema is a mature modelling approach widely used in relational data warehouses. The idea is that every table in the model is classed as one of two types.
- Dimension tables describe business entities: customers, products, employees, departments, dates. Each dimension has a unique key, such as a customer code, and descriptive columns: name, city, segment, category.
- Fact tables store events: sales lines, invoice entries, general ledger transactions, stock movements. They contain numeric measures (amount, quantity, cost of sales) and the dimension keys that link each event to a customer, product or date.
The name comes from the shape of the diagram: the fact table in the centre, with the dimensions around it like the points of a star.
| Characteristic | Dimension table | Fact table |
|---|---|---|
| Purpose | Filtering and grouping | Summing and calculating |
| Number of rows | Usually small | Large, growing daily |
| Key | Unique for each row | Repeats, as it points to the dimensions |
| Examples | Date, Customers, Products, Chart of accounts | Sales, General ledger entries, Stock movements |
| Relationship side | “One” | “Many” |
Why does this matter in Power BI specifically? The engine is optimised for filters that flow from a dimension to a fact table. When the model is organised as a star, a measure such as Pajamos = SUM(Pardavimai[Suma]) works correctly with any slice: by month, customer, product group or department, and you do not need to write a separate formula for each one.
How to relate fact and dimension tables
In a Power BI model, fact and dimension tables are normally connected by one-to-many relationships. The values in the column on the dimension side must be unique, and the relationship passes filters from one table to the other. According to the same documentation, one-to-many relationships within the same source group are the fastest in terms of filtering.
Practical rules:
- The key in the dimension must be unique. If the same code appears on two rows of the customer table, Power BI will not let you create a one-to-many relationship, or will suggest many-to-many instead, which is already a warning sign.
- Filter in a single direction. Filters flow from the dimension to the facts. Microsoft advises using bi-directional filtering sparingly and only in specific cases, for example when you need to analyse one dimension in the filter context of another.
- Keep relationships active wherever possible. An inactive relationship has to be switched on in a DAX formula, so every additional inactive relationship makes your measures more complicated.
- Use a separate date table. A single shared date dimension linked to all fact tables lets you compare sales, expenses and budget across the same time period.
If your model connects directly to a database, additional rules apply. In DirectQuery models, the “Assume referential integrity” option can speed up queries, because Power BI then generates INNER JOIN queries. We discussed which mode suits your situation in our article on choosing between DirectQuery and import.
A star schema from accounting data: revenue, expenses, profit
Accounting software stores data in the way that suits bookkeeping, not analysis. Document headers, document lines, the chart of accounts, business partner records and department classifications all sit in separate tables. The task is to turn them into a star. Here is how to do it step by step.
- Define the questions. For example: “What is the profit by department and month?”, “Which customers bring in the most revenue?”, “How do expenses compare with the budget?”. Each question shows which facts and which slices you need.
- Choose the fact tables. For profit analysis, the most convenient fact table is the general ledger entries: date, account, department, business partner, debit, credit. Sales analysis needs a separate fact table built from invoice lines, with product, quantity, amount and cost of sales.
- Build the dimensions. A typical set: Date, Chart of accounts (grouped into revenue, cost of sales and operating expenses), Departments, Business partners, Products. If product groups or account levels sit in separate tables in the source, merge them into a single dimension table in Power Query.
- Create the relationships. Each dimension connects to the fact table through its key, with a one-to-many relationship and single-direction filtering.
- Write the measures. Revenue, expenses and profit become simple measures based on the chart of accounts groups, for example
Pelnas = [Pajamos] - [Sąnaudos]. Because all the dimensions are shared, the same measure works in a report by month, department or project. - Add other sources. A budget from Excel or SharePoint becomes another fact table, linked to the same Date, Chart of accounts and Departments dimensions. This brings plan and actuals into one model, as we describe in our guide to budget comparison in Power BI.
Two or more fact tables with shared dimensions is still a star schema, just with several centres. The key point is that fact tables must not be linked to each other directly: they are connected only through shared dimensions. If you want to supplement Rivilė data with Excel files, you will find practical examples in our article on combining Rivilė, Excel and Power BI.
The snowflake schema in Power BI and how it differs
A snowflake dimension is a set of normalised tables for a single business entity. For example, a product is stored in three tables, Products, Product subgroups and Product groups, which are linked in a chain. In a Power BI model you can either reproduce this structure as separate tables or merge the source tables into one denormalised model table.
Microsoft’s documentation points to several drawbacks of a snowflake model in Power BI: more tables have to be loaded, filters travel along longer chains, so the model may be less efficient, and a hierarchy cannot be built from columns in different tables.
| Criterion | Star schema | Snowflake schema |
|---|---|---|
| Dimension structure | One wide table | Several normalised tables |
| Number of tables in the model | Fewer | More |
| Filter path | Short: dimension, facts | Long: group, subgroup, product, facts |
| Hierarchies | Built within one table | Columns from several tables cannot be combined |
| Field list for users | Clear | More tables, harder to navigate |
| Suitable for | Most Power BI models | Where the source structure or data governance rules require it |
When to choose a star schema and when a snowflake
For most Power BI projects the first choice is a star schema: it is simpler, faster and easier for report developers to work with. A snowflake structure makes sense when the source data is heavily normalised and merging it would be disproportionately complex, or when the company’s data governance rules require separate tables to be kept.
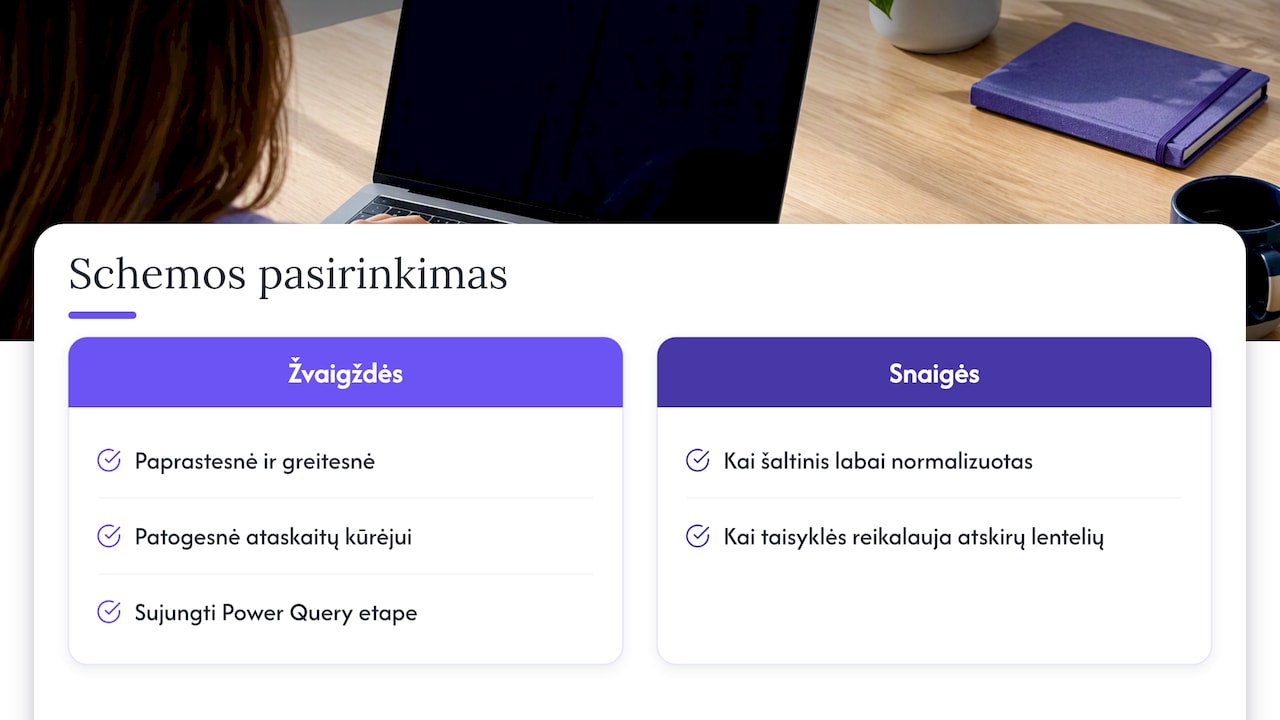
Even then, it is usually better to merge the normalised tables at the Power Query stage and leave a clean star in the model. Where there are many sources and the transformations are complex, an intermediate data warehouse is worth considering; we explained when you need one in our article on the Power BI data warehouse.
Common modelling mistakes
- One big table for everything. A flat table with every column quickly grows, and the DAX formulas become tangled. Split it into facts and dimensions.
- Bi-directional filtering “just in case”. It can produce unexpected results and slow the model down. Turn it on only where it is clearly needed.
- One-to-one relationships. Where one entity’s data is spread across several tables, such relationships are best avoided: they make fields harder to find and hierarchies harder to build, and can give unexpected results if rows do not match. Merge such tables into one.
- Relationships based on calculated columns in a DirectQuery model. It is better to create such a column in the source database.
- No separate date table. Without one, time comparisons such as this year against last year become unreliable.
- Complex measures from day one. In DirectQuery models, start with simple SUM, COUNT, MIN, MAX and AVERAGE measures and only then assess the performance of more complex ones.
Our approach
Many of the companies we work with come to us with reports that “sort of work”, but every new question means a new Excel sheet or a new formula. The most common cause is not the visuals and not the DAX, but the model.
That is why our ready-built Power BI report packages for Rivilė and Finvalda users are designed so that revenue, expenses, profit, the balance sheet, sales, inventory and outstanding debts can all be seen in a single Power BI model. The data refreshes automatically with no extra effort from users, and you work with the figures rather than with joining tables.
When a company needs more, we connect SharePoint, Excel, CRM or logistics data to the same model and tailor the solution to the company’s processes and existing IT systems. This is where a well-organised model pays off most: a new source becomes just another part of the model rather than a separate report.
Analitika360
Ready-built Power BI reports for Rivilė and Finvalda data
If you would rather not build a model from scratch, Analitika360 offers ready-built Power BI report packages for Rivilė and Finvalda data that refresh automatically. Rivilė Basic and Finvalda Basic cost €59 a month, while Rivilė PRO and Finvalda PRO cost €89 a month.
A model tailored to your processes, with additional sources, is built as a bespoke project at €70 an hour. You will find all prices and a comparison of plans on our business analytics pricing page.
FAQ
Will Power BI work without a star schema?
It will, but with caveats. A flat table or a snowflake structure is fine for small models, but as the data and the number of questions grow, formulas become more complex and reports slow down. The star schema is the foundation Microsoft recommends.
How many fact tables can one model have?
As many as your business processes require: sales, general ledger entries, budget, stock movements. What matters most is that they are linked through shared dimensions, such as date and department, and not directly to one another.
Where is it better to merge snowflake tables: in Power Query or in the model?
Usually in Power Query or in the source database. That leaves fewer tables in the model and shorter filter paths, and lets you build hierarchies within a single dimension.
Do I need to build the model myself with Analitika360 packages?

No. Our ready-built report packages for Rivilė and Finvalda users come fully prepared and refresh automatically, so you do not need to create tables and relationships yourself. In bespoke projects we tailor the solution to your processes and additional data sources.
Sources
- Understand star schema and the importance for Power BI
- Model relationships in Power BI Desktop
- DirectQuery model guidance in Power BI Desktop
- Bi-directional relationship guidance
- One-to-one relationship guidance