Your business in 360°
Cash Flow Forecasting: How to Build and Track a Forecast in Power BI

A cash flow forecast shows how much money a company will have in the bank in each coming week or month: the opening balance plus expected receipts minus expected payments. It answers a question that neither the profit and loss statement nor the annual cash flow statement can: will there be enough money for salaries, VAT and suppliers next month? Below you will find what data you need, how to calculate a forecast with a worked example, which Lithuanian tax deadlines to include, and how to build the forecast in Power BI so that it refreshes itself from Rivilė or Finvalda data.
In brief
- A forecast looks ahead, whereas the cash flow statement records the past. Profit and cash in the bank often do not match.
- The building blocks of a forecast are the opening balance, receipts, payments, net cash flow and the closing balance.
- In Lithuania, the forecast must provide for VAT, personal income tax, contributions to Sodra, the State Social Insurance Fund, and corporate income tax according to their payment deadlines.
- Power BI lets you combine actual accounting data with a plan from Excel and compare forecast against actual every day.
- Check accuracy regularly: compare the forecast and actual closing balance and refine your assumptions.
Contents
- How a forecast differs from the cash flow statement and profit
- What data and assumptions you need
- How to calculate a forecast: an example
- Lithuanian tax deadlines in the forecast
- How to build a forecast in Power BI
- How to check accuracy and update the forecast
- Our view
- A forecast built on automatically refreshed data
- FAQ
- Sources
How a forecast differs from the cash flow statement and profit
Swedbank defines a cash flow forecast as a tool that helps you judge whether funds will be sufficient at each stage of operations: it records future payments and receipts. It is a management tool, not a mandatory financial statement.
The three documents answer different questions:
| Document | Period | Basis | Answers the question |
|---|---|---|---|
| Profit and loss statement | Past | Accruals | Is the business profitable? |
| Cash flow statement | Past | Actual payments | Where did the money go and where did it come from? |
| Cash flow forecast | Future | Expected payments | Will there be enough money tomorrow, next week, next quarter? |
In the profit and loss statement, revenue is recognised when the invoice is issued, even if the customer pays 60 days later. That is why, as the Finero finance glossary points out, a profitable company can still be short of cash. A forecast reveals this gap in advance, while there is still time to act: speed up debt collection, postpone a purchase or arrange financing.
What data and assumptions you need
A reliable forecast rests on facts from the accounts and clearly written-down assumptions. Before you start, gather:
- The opening cash balance across all bank accounts and petty cash on the start date of the forecast.
- Receivables with their payment terms and customers’ actual payment behaviour: how late, on average, each larger customer pays.
- Payables to suppliers with their due dates.
- Fixed payments: rent, salaries, leasing, loan repayments, subscriptions.
- Tax liabilities: VAT, personal income tax, Sodra contributions, corporate income tax.
- The sales plan: how much new business you expect and when it will turn into cash.
- One-off flows: investments, asset sales, grants, dividends.
Choose the period according to your purpose. For managing short-term liquidity, a weekly forecast covering a few months ahead works well; for budgeting and assessing financing needs, a monthly forecast for the year. Many finance teams use both: weekly for operational decisions and monthly for management.
Receivables are usually the weakest point of a forecast. If debt data is in good order and visible every day, the forecast becomes far more accurate. We have described how to automate this in our articles on Finvalda receivables management and Rivilė debt analysis.
How to calculate a forecast: an example
The calculation logic is simple:
- Net cash flow = receipts − payments
- Closing balance = opening balance + net cash flow
- Next period’s opening balance = this period’s closing balance
Suppose a services company is preparing a forecast for three months:
| Line | January | February | March |
|---|---|---|---|
| Opening balance | €42,000 | €36,300 | €41,900 |
| Receipts from customers | €66,000 | €71,500 | €69,000 |
| Other receipts | €2,500 | €0 | €0 |
| Salaries and Sodra | −€38,000 | −€38,000 | −€38,000 |
| Suppliers and rent | −€24,700 | −€22,400 | −€23,100 |
| VAT and other taxes | −€11,500 | −€5,500 | −€12,800 |
| Net cash flow | −€5,700 | €5,600 | −€4,900 |
| Closing balance | €36,300 | €41,900 | €37,000 |
The example shows a typical situation: cash falls in January because of higher tax payments, even though sales are stable. The forecast shows this kind of fluctuation in advance, so the manager can decide whether a buffer is needed or whether it is enough to speed up payments from a few customers.
Lithuanian tax deadlines in the forecast
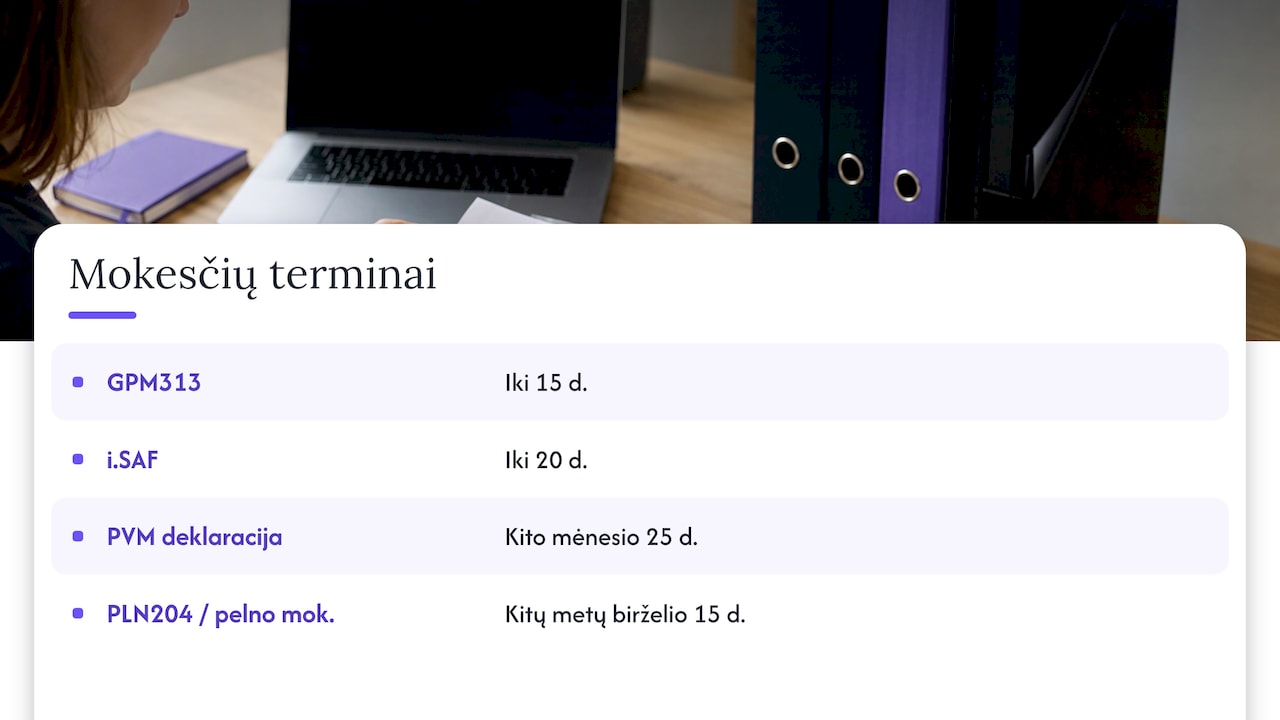
Taxes are the largest and most predictable payments, so it pays to schedule them on their exact dates. The main monthly deadlines: the VAT return is due by the 25th of the following month, i.SAF (the tax authority’s invoice register) by the 20th, and GPM313 (the monthly personal income tax return) by the 15th. Where the tax period coincides with the calendar year, the PLN204 corporate income tax return is filed and corporate income tax paid by 15 June of the following year.
Rates matter in the forecast too. From 2026 the standard corporate income tax rate has risen from 16% to 17%, and the reduced rate for small entities from 6% to 7%. If the company pays corporate income tax in advance instalments, include these as a separate line as well.
A practical tip: calculate the tax lines from actual accounting data rather than entering them by hand. For example, the VAT payment can be calculated from the difference between last month’s output and input VAT. Agree your company’s specific deadlines and advance amounts with your accountant, as they depend on the company’s status and tax period.
How to build a forecast in Power BI
An Excel spreadsheet is fine to start with, but it has to be updated by hand all the time. A Power BI model brings actuals and plan together in one place, and the data refreshes automatically. The steps:
- Connect the actual data. From Rivilė or Finvalda, take bank transactions, receivables and payables with due dates, and general ledger data.
- Connect the plan data. Keep the sales plan, investments and other assumptions in an Excel or SharePoint file maintained by the people responsible. We explain how in our guide to connecting Rivilė, Excel and Power BI.
- Create a date table with weeks and months, so that actuals and forecast are compared on the same time basis.
- Group the flows into categories: customer receipts, salaries, suppliers, taxes, financing.
- Calculate the measures: receipts, payments, net cash flow and the cumulative balance.
- Add scenarios. Power BI “What-If” parameters let you change assumptions, such as customer payment delays or sales growth, and immediately see the effect on the balance. ChallengeJP describes this method for financial planning.
- Switch on automatic refresh so that the report shows the latest data every morning. More on this: automatic report refresh.
Which visuals should you choose? Microsoft Dynamics 365 Cash overview content offers a good reference point: cash is analysed by legal entity, currency and bank account, receipts and payments are shown, balances are forecast, and today’s actual and forecast balance are displayed. A company director usually needs just three elements: a line chart of the cumulative balance, columns of receipts and payments by week, and a table of the largest expected amounts.
If your finance team is just getting started, it is worth reading our guide to cash flow analysis in Power BI, and sales forecasting with Power BI will help you estimate your sales assumptions more accurately.
How to check accuracy and update the forecast
A forecast is only valuable when it is compared with actuals regularly. The simplest accuracy formula:
Accuracy = 1 − |actual − forecast| / actual
If you forecast a January closing balance of €36,300 and actually had €38,000, accuracy is about 95.5%.
A regular review involves several steps:
- Compare the forecast and actual closing balance for the period.
- Investigate the largest variances by category: did customers pay late, or were there unexpected payments?
- Check the ageing of receivables.
- Reassess your biggest revenue assumption.
- Update fixed costs if rent, salaries or contracts have changed.
- Roll the forecast forward so that the horizon stays the same length.
When actuals and plan sit in one Power BI model, the plan-versus-actual comparison comes naturally. We apply the same principle in our budget comparison reports.
Our view
Working with Rivilė and Finvalda users, we see that cash flow forecasts usually stall not because of formulas but because of data. When debt, bank and cost data are moved into Excel by hand every month, the forecast is out of date before anyone has even read it.
That is why we first build a solid foundation of actual data: revenue, costs, profit, the balance sheet, debts and inventory refresh automatically from the accounting system with no extra work for the user. On this foundation, the forecast becomes a tool that is always running, rather than a quarterly chore.
The second principle: all sources in one model. Plan files from Excel or SharePoint, and CRM or logistics data, are combined with the accounting actuals, so the manager sees a single figure rather than several conflicting versions.
Analitika360
A forecast built on automatically refreshed data
Analitika360 prepares Power BI report packages for Rivilė and Finvalda users. The Rivilė Basic and Finvalda Basic plans cost €59 a month, and the Rivilė PRO and Finvalda PRO plans €89 a month. In them, revenue, cost, profit, balance sheet and debt indicators refresh automatically, so you always have the latest actuals for your forecast.

If you need a cash flow forecast tailored to your company’s processes, with plan files, scenarios or several data sources, we build it as a bespoke project at €70 an hour. Compare the plans and choose the right one on our business analytics pricing page, or take a look at our Rivilė, Finvalda and Power BI packages.
FAQ
How does a cash flow forecast differ from a budget?
A budget plans revenue and costs on an accruals basis, whereas a forecast plans actual cash receipts and payments. The budget shows whether the year will be profitable; the forecast shows whether there will be enough cash every week. They work best together, in a single model.
What period should the forecast cover?
For managing operational liquidity, a weekly forecast covering a few months ahead is most common. For financing needs and the annual plan, a 12-month monthly forecast works well. The key is to roll it forward regularly so the horizon does not shrink.
Can I build a forecast in Power BI from Rivilė or Finvalda data?
Yes. Actual data (bank transactions, receivables and payables) comes from the accounting system, and plan assumptions from Excel or SharePoint. Power BI combines them and refreshes them automatically.
How often should the forecast be updated?
When the data refreshes automatically, you can see balances every day. Assumptions such as the sales plan or customer payment terms are worth reviewing at least once a month, when comparing the forecast with actuals.
Sources
Swedbank: Cash flow forecast Finero: Cash flow statement Apskaitos paslaugos: Private limited company (UAB) accounting and filing deadlines Megakalendorius: Tax calendar 2026 Paciolis: Tax changes 2026 ChallengeJP: Financial Planning and Analysis Dashboard in Power BI Microsoft Learn: Cash overview Power BI content