Your business in 360°
Streaming Data in Power BI: Push, Streaming Datasets and Event Hubs

Power BI can display real-time data in three ways: through a push semantic model, which stores data and lets you build reports; through a streaming model, which holds data only in a temporary cache and shows it in dashboard tiles with almost no delay; and through a combination of the two, most often fed from Azure Event Hubs and Stream Analytics. The most important thing to know is that creating new real-time models is supported until 31 October 2027, so any new long-term solution is worth planning now. Below we explain how these models differ, how to create them, what their limits are and when automatically refreshed reports are enough for a business.
In brief
- A push model creates a database in the Power BI service: you can build reports, alerts and tiles that update in real time.
- A streaming model has no database: data is held in a one-hour temporary cache and shown only in custom streaming tiles.
- Event Hubs usually passes data to Power BI via Azure Stream Analytics, which creates a hybrid push and streaming model.
- From 31 October 2027 it will no longer be possible to create new push, streaming or PubNub models, and Microsoft recommends Fabric Real-Time Intelligence instead.
- For financial figures from accounting systems, automatically refreshed Power BI reports are usually enough, with no separate streaming infrastructure.
Contents
- Three types of real-time semantic model
- Push or streaming model: how to choose
- How to create a streaming dataset and send data to it
- Event Hubs and Stream Analytics: the route to the dashboard
- Limits worth knowing in advance
- What changes by 31 October 2027
- When automatically refreshed reports are enough
- Our view
- Ready-built Power BI packages for Rivilė and Finvalda users
- FAQ
- Sources
Three types of real-time semantic model
Microsoft’s documentation distinguishes several types of real-time model. Each solves a different problem, so the choice depends on whether you need history or just a snapshot of the moment.
| Feature | Push model | Streaming model | Hybrid (pushStreaming) |
|---|---|---|---|
| Data storage | Database in the Power BI service | Temporary cache only, roughly a 1-hour window | Both database and cache |
| Reports | Yes | No | Yes |
| Dashboard tiles | Pinned visuals that update in real time | Custom streaming tiles only | Both options |
| Data alerts | Yes | No | Yes |
| Latency | Low | Minimal | Depends on the visual |
| Request limit | 1 request up to 16 MB, up to 1 million rows per hour | 5 requests of 15 KB each, unlimited throughput | Both apply |
The figures in the table are based on Microsoft Learn’s description of real-time streaming. The same page notes that switching on the Historic data analysis option makes a model both push and streaming. The third official type, PubNub, does not send data to Power BI at all: the visual connects directly to the PubNub stream.
Push or streaming model: how to choose
Three questions settle the decision.
- Do you need history? If you want to see not just the last hour but daily, weekly or monthly trends, choose a push or hybrid model. A streaming model does not keep data for long.
- Does every second count? A streaming model suits cases where latency must be kept to a minimum and data can be shown exactly as it arrives: temperature, device status or pre-calculated averages.
- Where will users look? A streaming model appears only on a dashboard. If your team works with report pages, filters and slicers, you need a push model.
When you create a model through the Power BI REST API, the mode is set by the defaultMode flag: if you leave it out, a push model is created, while the value pushStreaming gives you the advantages of both types.
How to create a streaming dataset and send data to it
A streaming model is created in the Power BI service (in the browser), not in Power BI Desktop. The general process is as follows:
- Open a workspace in the Power BI service and choose to create a new streaming semantic model.
- Select the source: API, Azure Stream Analytics or PubNub.
- Define the fields and their types. If you plan a line chart on a time axis, include a date and time field.
- If you need history and reports, switch on Historic data analysis.
- Copy the generated push URL and send JSON rows to it from your application, script or automation tool.
- On the dashboard, add a custom streaming tile and choose a visual: card, line chart, gauge or column chart.
Bear in mind that a Pro licence is required to create Power BI items in workspaces other than “My workspace”. The same page explains that Premium Per User (PPU) licences give access to Premium features by licensing each user individually, and work out more economical when fewer than 250 people need them.
Event Hubs and Stream Analytics: the route to the dashboard
When data arrives from many sources at once, such as sensors, till systems or application logs, the most convenient approach is to collect it through Azure Event Hubs, process it in Stream Analytics and output it to Power BI.
In Microsoft’s no-code Stream Analytics tutorial, the connection works like this:
- You select the Event Hubs namespace and the specific event hub.
- You click Process data and choose the blank canvas template.
- You set the consumer group to Default, serialisation to JSON and authentication to Connection String.
- You add transformations (filters, aggregation over time windows) and a Power BI output.
Stream Analytics creates a hybrid model in Power BI, so you get both stored data for reports and streaming tiles. In the event ordering settings, it is recommended to set a tolerance for out-of-order events (e.g. 5 seconds) and late-arriving events (e.g. 10 seconds). If the data is sent by Internet of Things devices, Azure IoT Hub additionally provides device management and per-device authentication.
Limits worth knowing in advance
When designing a streaming solution, it is important to take the technical constraints into account:
- Power BI applies a FIFO retention policy: data accumulates until it reaches 200,000 rows, after which the oldest rows are removed.
- Stream Analytics can call Power BI roughly once per second, and streaming visuals support packets of 15 KB.
- The streaming model’s cache holds roughly a one-hour window, so analysis over longer periods is not possible within it.
- A streaming model shows data exactly as it arrives, so averages and other calculations are best done before sending, for example in a Stream Analytics query.
What changes by 31 October 2027
Microsoft has announced that real-time streaming in Power BI is being retired. According to the official documentation, creation of streaming models remains enabled until 31 October 2027. After that date it will no longer be possible to create new push, streaming or PubNub models or streaming tiles, although models already created will continue to work.
On the Azure Stream Analytics side, the change is stricter: from 31 October 2027 it will no longer be possible to create jobs with the Power BI output connector, and running jobs that use this connector will be stopped. As an alternative, Microsoft recommends the Real-Time Intelligence solution in Microsoft Fabric.
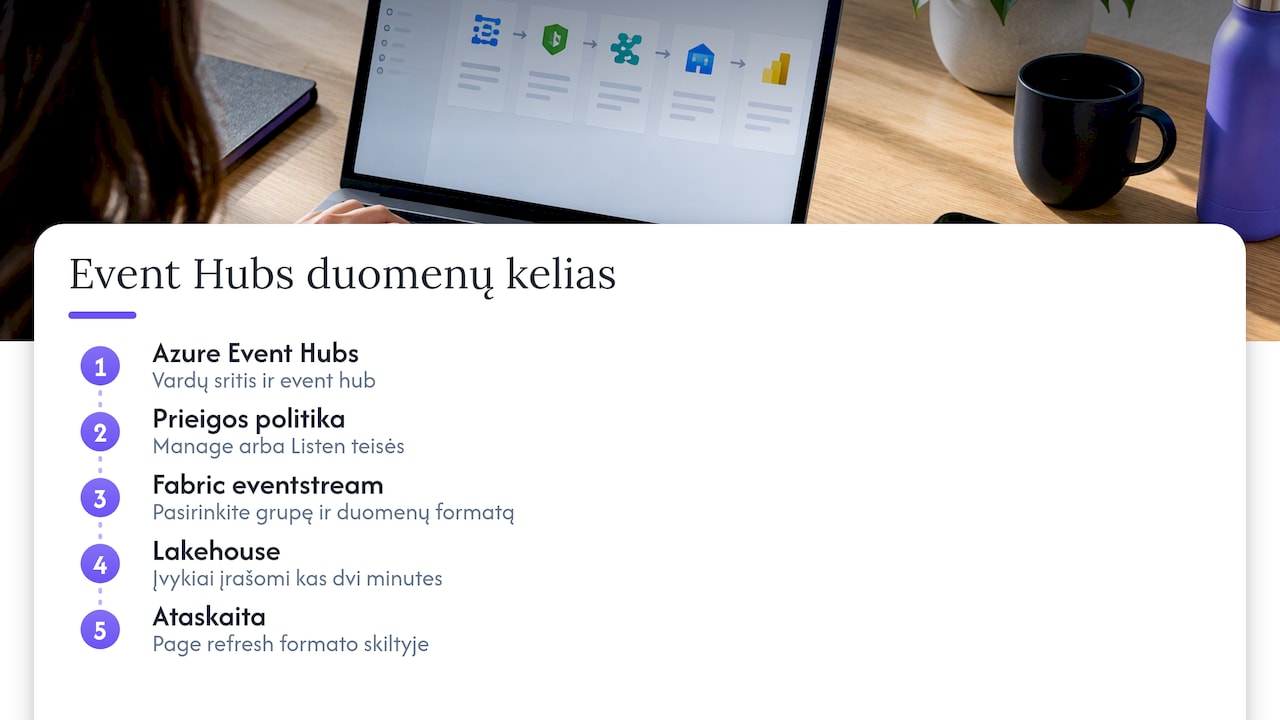
In Fabric, Event Hubs is connected as an eventstream source: you select New source, then Azure Event Hubs, enter the namespace and event hub names, create an access policy with Manage or Listen permissions, and choose the consumer group and data format. The Fabric tutorial states that events are written to the lakehouse every two minutes, and that the report refresh interval can be set in the Page refresh section of the format pane.
When automatically refreshed reports are enough
Not every metric needs to be accurate to the second. Revenue, expenses, profit, the balance sheet, debts or stock levels change along with accounting documents, so what matters most to a manager is that the report refreshes automatically, with no manual work. Scheduled refresh suits this kind of data: we covered its settings and limits in our article on Power BI scheduled refresh. If the data sits on a company server, the Power BI data gateway connects it reliably to the cloud.
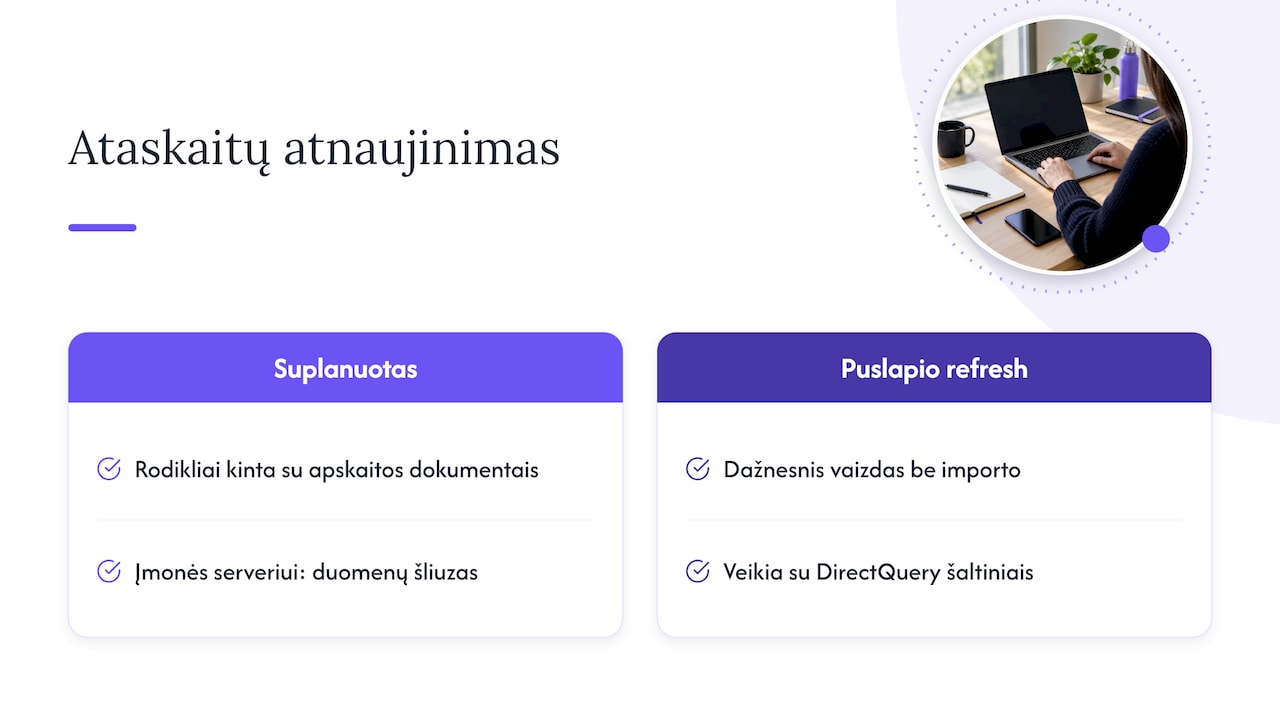
If you need a more frequent view without importing data, automatic page refresh in the Power BI service works with DirectQuery sources. As data volumes and the number of sources grow, it is worth assessing when a business needs a data warehouse.
Our view
We work every day with Lithuanian companies’ financial data from Rivilė and Finvalda, so we see what managers, accountants and finance directors actually need. Most of the time it is not accuracy to the second but reliable figures, brought together in one place, that refresh on their own.
Streaming analytics is ideal for sensors, devices and event streams. For financial decisions, what matters more is a coherent Power BI model in which accounting data is linked with SharePoint, Excel, CRM or logistics sources. That is exactly the kind of solution we build: ready-made report packages and bespoke projects tailored to a company’s processes and existing IT systems.
Our reports refresh automatically, with no extra input from the user. That means a restaurant owner or an accountant sees up-to-date revenue, expense and profit figures in the morning, and spends their time on decisions rather than on gathering data.
Analitika360
Ready-built Power BI packages for Rivilė and Finvalda users
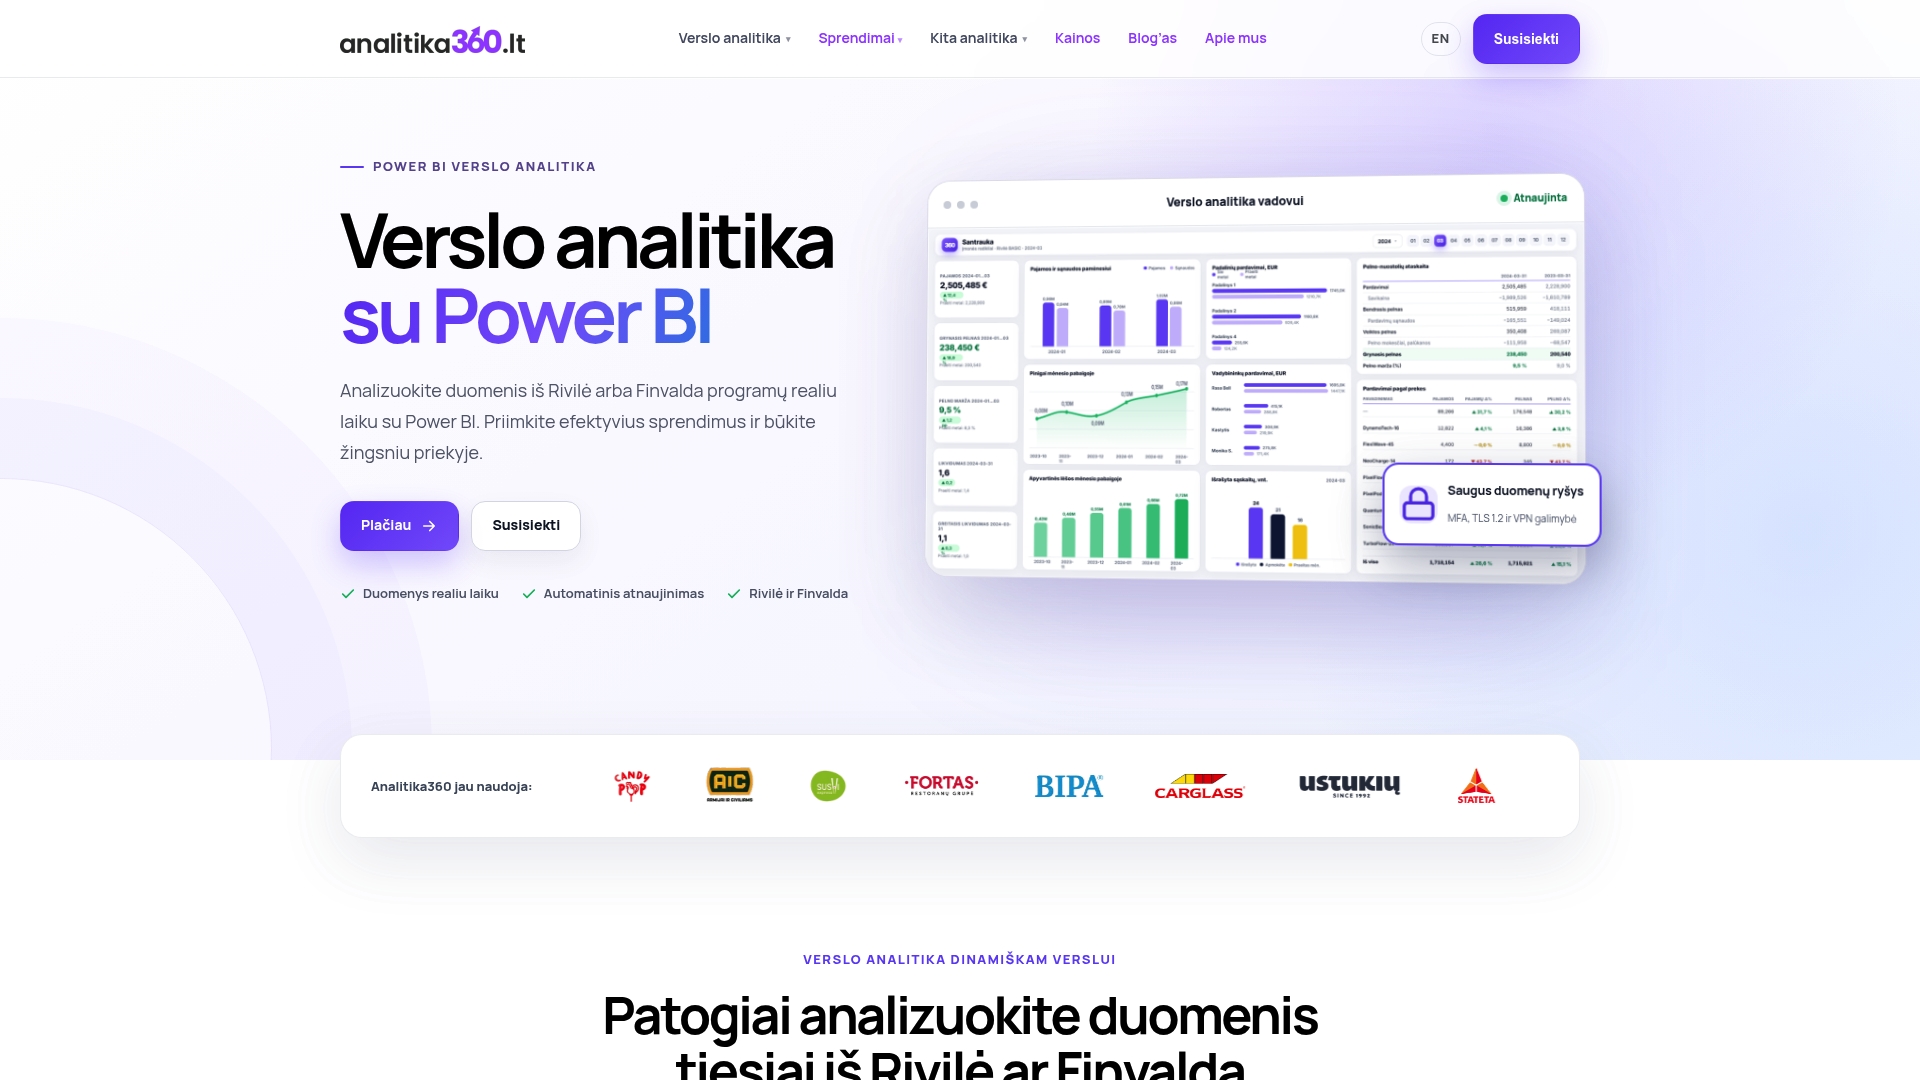
If your company uses Rivilė or Finvalda, Analitika360 can offer ready-built Power BI report packages with automatic data refresh: revenue, expenses, profit, the balance sheet, sales, inventory and debts in a single model.
- Rivilė Basic and Finvalda Basic: €59 a month.
- Rivilė PRO and Finvalda PRO: €89 a month.
- Bespoke projects: €70 an hour, when additional sources need to be integrated or reports tailored to your processes.
We also help you obtain the Microsoft Pro and Premium licences you need. You will find the full terms on our business analytics pricing page, and Rivilė users are best off starting with the Rivilė Basic package.
FAQ
Can a streaming dataset be created in Power BI Desktop?
No. A streaming semantic model is created in the Power BI service or through the REST API. In Desktop you can build reports from a push model, but not the streaming dataset itself.
How long is data kept in a streaming model?
A streaming model holds data only in a temporary cache with a window of about one hour. If you need a longer history, switch on Historic data analysis or use a push model.
Will my existing streaming models stop working in 2027?
According to Microsoft’s documentation, existing streaming semantic models remain unaffected after 31 October 2027; only the creation of new ones will no longer be possible. However, Stream Analytics jobs with the Power BI output connector will be stopped on that date, so it is worth moving them to Fabric Real-Time Intelligence in advance.
What licence do I need for a real-time dashboard?
A Pro licence is needed to create Power BI items in shared workspaces. For Premium features, a Premium Per User licence is often more economical for smaller teams.
Do Rivilė and Finvalda data need a streaming model?
Usually not. For accounting figures, an automatically refreshed Power BI model is enough, and Analitika360 provides one as a package on a monthly subscription.
Sources
- Microsoft Learn: Real-time streaming in Power BI
- Microsoft Learn: Power BI output from Azure Stream Analytics
- Microsoft Learn: Build real-time Power BI dashboards with Stream Analytics no-code editor
- Microsoft Learn: Ingest, filter, and transform real-time events (Fabric)
- Microsoft Learn: Understand Microsoft Fabric licenses and capacity
- Microsoft Learn: Automatic page refresh in Power BI
- OneUptime: How to Build Real-Time Power BI Dashboards with Azure Stream Analytics