Your business in 360°
Power BI data lineage: the path from source to report

Power BI data lineage shows where a figure in a report comes from. You can see which data source it is taken from, which semantic model or dataflow it passes through, and which reports and dashboards it ends up in. In the Power BI service this is shown in lineage view. It can be opened by workspace members with a Pro licence and an Admin, Member or Contributor role. Below you will find how to open the view, what it shows and how to use it when checking revenue, expense and profit reports built from Rivilė or Finvalda data.
In brief
- Data lineage is a diagram: data sources, semantic models, dataflows, reports and dashboards, joined by arrows that follow the direction in which the data flows.
- To open lineage view, go to the workspace and choose ‘View’ → ‘Lineage’. You need a Power BI Pro licence and an Admin, Member or Contributor role.
- Impact analysis, run before you change a model, shows how many reports and workspaces the change will affect and how many people view them.
- When a report fails to refresh, lineage view helps you quickly find the link in the chain where the refresh broke.
- For accountants and finance managers, lineage answers the question that determines whether a figure can be trusted: where did it come from and when was it last refreshed?
Contents
- What data lineage is in Power BI
- What lineage view shows
- Who can see lineage view
- How to open lineage view: step by step
- Impact analysis before changing a model
- How lineage helps you find refresh errors
- Data lineage in the work of accountants and finance teams
- When you need lineage beyond Power BI
- Our view
- Ready-built Power BI packages for Rivilė and Finvalda users
- FAQ
- Sources
What data lineage is in Power BI
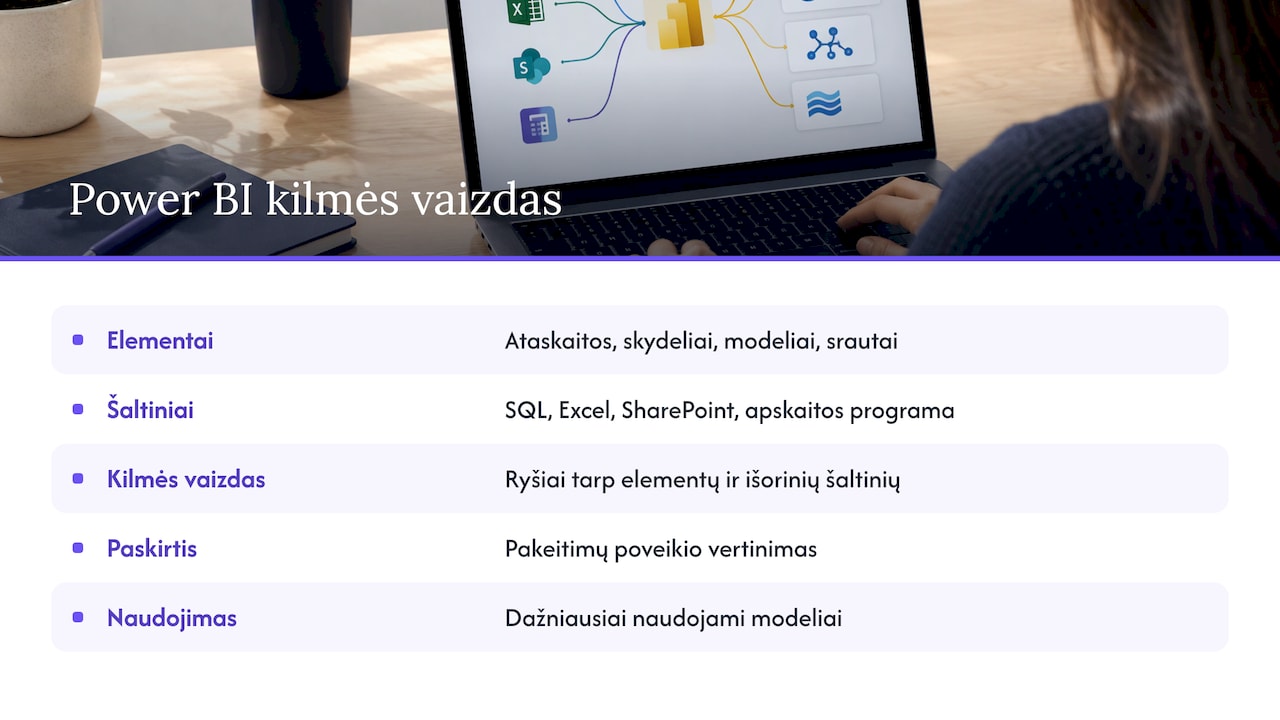
Power BI has several types of item: reports, dashboards, semantic models (formerly called datasets) and dataflows. Most semantic models and dataflows connect to external sources: a SQL database, an Excel file, a SharePoint list or an accounting system. As the number of these items grows, simple questions become hard to answer. What will happen if I change this model? Why didn’t this report refresh?
That is exactly what Power BI lineage view is for. It shows the relationships between all the items in a workspace and their external dependencies. When Microsoft introduced the feature, it noted that lineage insights help you manage dependencies, assess the impact of planned changes and see which models are used most often.
In practice, lineage is a map of your analytics system. Once you have seen it, you know which model to handle with care and which can be changed without risk.
What lineage view shows
Each item in lineage view is a card, and the arrows show the direction of the data from left to right: from the source to the user.
| Item | What you see on the card | Why it matters |
|---|---|---|
| Data source | The type and name of the source from which the semantic model or dataflow gets its data | To check that the report is based on the right database or file |
| Semantic model | The time of the last refresh and a ‘certified’ or ‘promoted’ badge | To make sure the figures are up to date and the model has been approved |
| Dataflow | The time of the last refresh and the certification status | To find a shared data preparation step used by several models |
| Report and dashboard | Which model it is based on | To know which reports a change will affect |
| External link | The name of the other workspace, if the model sits there | To see dependencies beyond your own workspace |
All of this is described in Microsoft’s lineage view documentation. The refresh date on the model card is particularly useful: a quick glance tells you whether yesterday’s sales report figures really are from yesterday.
Who can see lineage view
Lineage view is not available to every report reader. Microsoft’s requirements are:
- Licence. You need a Power BI Pro licence.
- Access. You must have access to the workspace in question.
- Role. You need an Admin, Member or Contributor role. A user with the Viewer role cannot switch to lineage view.
This makes sense: the lineage diagram exposes how the system is built, whereas an ordinary report reader only needs the figures themselves. We cover how to allocate workspace roles within a company in more detail in our article on Power BI governance and roles.
How to open lineage view: step by step
- Sign in to the Power BI service and open the workspace you need.
- Make sure you are in list view.
- Click the arrow next to ‘View’ and select ‘Lineage’.
- All the items in the workspace will appear on screen, with arrows between them.
- To see the path of a single item, click the double-arrow icon below its card. Power BI will highlight every item related to it and grey out the rest.
- You can return to the normal view through the same ‘View’ menu.
These steps are taken from the official Power BI lineage guide. Microsoft’s interface changes from time to time, so if the menu names look different, check the latest version of the guide.
Impact analysis before changing a model
Lineage view shows a single workspace. When a model is used by reports in several workspaces, semantic model impact analysis helps. It shows:
- how many workspaces, reports and dashboards a change could affect;
- how many different people have viewed those reports and how many times (data for the last 30 days, excluding the current day);
- an option to send a notification to the contacts of the affected workspaces.
The view counts help you decide what to check first. If you rename the ‘Revenue’ column and see that ten reports depend on the model, start with the ones management opens every day.
There is also data source impact analysis. It shows which models and dataflows across the whole organisation use a particular source. This comes in handy when you are planning a server migration or an upgrade of your accounting system.
How lineage helps you find refresh errors
During a refresh, a semantic model has to fetch data from its sources, load it into the model and update the visuals. If any link in that chain breaks, the report shows old figures. Microsoft recommends checking models regularly: an error is flagged with a warning icon in the list, and the cause can be seen in the refresh history.
A practical sequence:
- In lineage view, find the report with out-of-date data.
- Follow the arrows back to the semantic model and look at the time of the last refresh.
- If the model is based on a dataflow, check that too. If a dataflow refresh fails, the data is not refreshed at all, even if the error is in only one table.
- Read the error message in the refresh history.
- If the source is an on-premises server, check the Power BI data gateway, as that is where the connection most often breaks.
Once you know which link is at fault, you can fix the problem in a few minutes instead of checking every report one by one.
Data lineage in the work of accountants and finance teams
In a financial report, every figure needs an address. When the managing director asks why October’s profit in the report differs from what the accounting system shows, lineage view helps you answer quickly.
Tracing a figure back to its source. The profit report is based on a semantic model, which connects to the Rivilė or Finvalda database and, for example, to a budget Excel file in SharePoint. Lineage view shows you at once which sources are involved. If the discrepancy appears only in the budget lines, you look in the Excel file, not in the accounts. We explain how to combine such sources in one model in our guide to combining Rivilė, Excel and Power BI data.
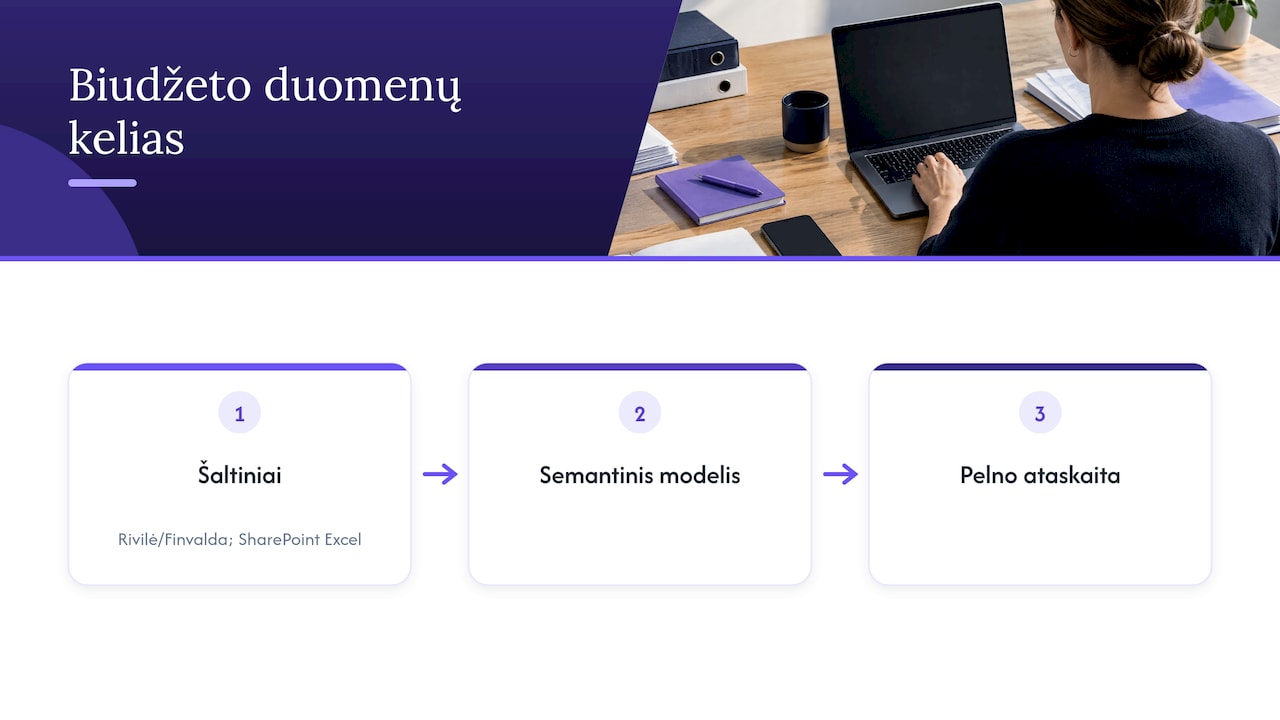
Refresh time before month-end close. Before sending the monthly results to the board, check the last refresh time on the model card. If it is earlier than the latest accounting entries, refresh the data first.
Certified models. The ‘certified’ badge shows that the model has been checked by the person responsible for it. It is worth the finance team agreeing that official reports are based only on certified models.
Change control. If you change the grouping of the chart of accounts or the expense categories, impact analysis shows which profit, budget and debt reports will be affected. For a broader check, our data quality monitoring checklist is useful, and who changed which items and when can be seen in the Power BI audit logs.
When you need lineage beyond Power BI
Power BI lineage view covers the path from source to report. If an organisation also needs to see what happens before the data reaches Power BI, for example at column level in a data warehouse, Microsoft offers the Purview Data Map. There, lineage between Power BI and external sources is supported for Azure SQL Database, Azure Blob Storage and Azure Data Lake Store sources, while column-level lineage works with Azure SQL Database.
For most medium-sized Lithuanian companies, whose data sits in an accounting system and a few Excel files, Power BI lineage view and a well-organised model are enough. What matters most is that the model is built clearly: one certified finance model, clearly named sources and automatic refresh. We discussed when it is worth considering a separate data layer in our article on Power BI data storage.
Our view
Lineage view is only as clear as the analytics system itself. If a company has twenty similar models built by different people, the diagram will look like a cobweb, and even with lineage view it will be hard to say which figure to believe.
That is why Analitika360 builds its report packages for Rivilė and Finvalda users around a single Power BI model. We integrate other sources into it as well: SharePoint, Excel, CRM or logistics data. The data refreshes automatically, with no extra work for the user. The lineage diagram then stays short and easy to follow: the accounting system, the additional sources, one model and the reports used by managers and accountants.
Our experience with restaurant chains and accountants shows that the biggest time saving comes not from finding errors quickly but from having fewer of them in the first place. A well-organised model and automatic refresh let the finance team talk about results rather than argue over which report is correct.
Analitika360
Ready-built Power BI packages for Rivilė and Finvalda users
If you want your revenue, expense, profit, balance sheet, sales, inventory and debt reports to refresh by themselves, with every figure having a clear path back to the accounting system, Analitika360 offers ready-built report packages.
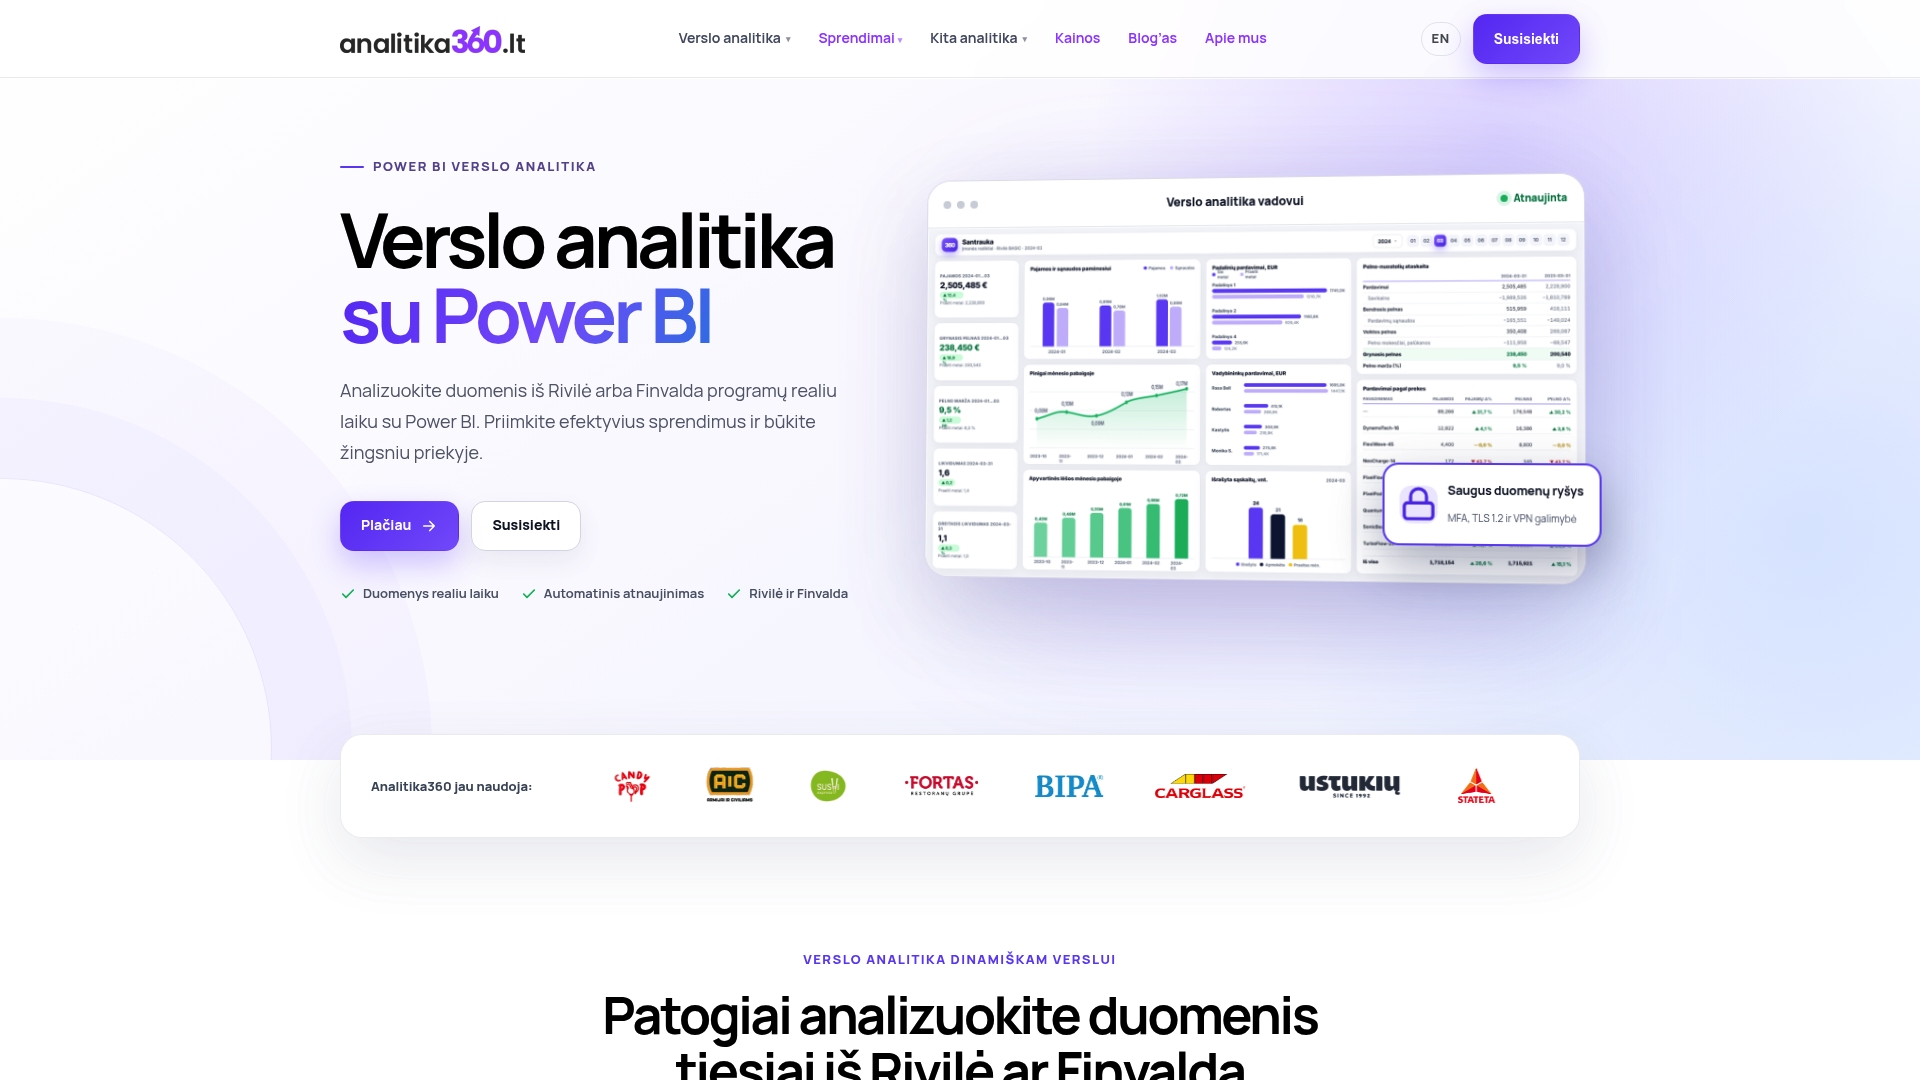
- Rivilė Basic and Finvalda Basic: €59 a month.
- Rivilė PRO and Finvalda PRO: €89 a month.
- Custom projects tailored to your processes and IT systems: €70 an hour.
We also help with Microsoft Power BI Pro and Premium licences. Compare the plans on the business analytics pricing page or start with the Rivilė Basic package.
FAQ
Can I see lineage view in Power BI Desktop?
Lineage view is a feature of the Power BI service and is opened in a workspace in your browser. In Desktop you can see your model’s tables and relationships, but not the connections between published reports, models and workspaces.
Why can’t I see the ‘Lineage’ menu?
Most often it is because you have the Viewer role in the workspace or do not have a Pro licence. Ask the workspace administrator to give you the Contributor, Member or Admin role.
What is the difference between lineage view and impact analysis?
Lineage view shows the relationships between all the items in a workspace in a single diagram. Impact analysis focuses on one model or source and shows which reports and workspaces a change will affect and how many people use them.
Is lineage view useful for a small company with a single report?
Yes, when the report is based on several sources, such as an accounting system and an Excel file. A single diagram shows where each figure comes from and when it was last refreshed, which matters before every management meeting.
Sources
Data lineage - Power BI, Microsoft Learn Data lineage, Power Platform release plan, Microsoft Learn Semantic model impact analysis - Power BI, Microsoft Learn Data source impact analysis - Power BI, Microsoft Learn Data refresh in Power BI, Microsoft Learn Understand and optimize dataflows refresh, Microsoft Learn Metadata and lineage from Power BI into Microsoft Purview, Microsoft Learn