Your business in 360°
Power BI audit logs: where to find them and how to use them

Power BI audit logs show who did what, when and to which item: viewed a report, published it, changed it, shared it or exported its data. You can find the records in the Microsoft Purview portal or retrieve them programmatically through the Power BI REST API and PowerShell. This guide covers the permissions you need, how to filter and export records, how long they are kept and how to turn them into a useful management report.
In brief
- Power BI activity is recorded in two ways: in the Microsoft Purview audit log and in the Power BI activity log, which an administrator accesses through the REST API.
- To view the Purview audit log you need the “Audit Logs” or “View-Only Audit Logs” role.
- “Audit (Standard)” records are kept for 180 days, so for a longer history the data must be exported regularly.
- Most events appear within 30 minutes, but the delay can be up to 60 minutes.
- The greatest value comes when the log data flows automatically into a dedicated Power BI report on usage and sharing.
Contents
- What Power BI audit logs are
- Where to find audit logs and what permissions you need
- How to filter and export records
- Programmatic access: REST API and PowerShell
- How long records are kept and when they appear
- Putting audit data to practical use
- Our view
- Power BI analytics ready for your business
- FAQ
- Sources
What Power BI audit logs are
An audit log is a history of actions. Each record answers four questions: who (a user or a service principal), did what (the operation), to what (a report, semantic model or workspace) and when.
According to Microsoft, the Power BI activity log covers Power BI activities and helps establish who performed an action on a particular item. The full list of recorded operations, from viewing a report to changing workspace permissions, is given in the Purview audit activities table.
In practice, the events most often checked are:
- Views. Who opens reports and dashboards, and how often.
- Changes. Who published a new version, deleted or renamed an item.
- Sharing. Who has been given access, and whether anything has been shared with external users.
- Exports. Who exported data to Excel, CSV or PDF.
- Administration. Changes to tenant settings, workspaces and permissions.
Two routes to the same data
| Criterion | Microsoft Purview audit log | Power BI activity log |
|---|---|---|
| Where it is accessed | In the Purview portal, under “Audit” | Through the Power BI REST API and PowerShell |
| Who can see it | Users with the “Audit Logs” or “View-Only Audit Logs” role | Administrators with access to the admin API |
| Scope | All Microsoft 365 services, including Power BI | Power BI and Fabric activities only |
| Export | CSV, up to 50,000 or 1,000,000 records | JSON via an automated script |
| Best suited to | One-off investigations, compliance checks | Ongoing monitoring and reporting |
Where to find audit logs and what permissions you need
The Power BI admin portal has an “Audit logs” tab, but the log itself is managed not in Power BI but in the Microsoft Purview compliance portal: the tab simply redirects you there.
Permissions are the most common stumbling block. Microsoft states that to access the log you need the “Audit Logs” role in Exchange Online, which by default is held by the “Compliance Management” and “Organization Management” role groups. In the Purview portal the relevant roles are “Audit Logs” or “View-Only Audit Logs”. If a finance director only needs to see the records, the view-only role is enough.
To view the log:
- Sign in to the Microsoft Purview portal.
- Open Solutions and select Audit.
- Set the date range.
- In the “Activities” field, select the Power BI activities, for example viewing or sharing a report.
- If needed, enter a specific user or item name.
- Run the search and review the results or export them.
It is best to decide in advance who holds which permissions. We wrote about assigning roles in our article on Power BI governance and roles.
How to filter and export records
Purview search results can be exported to a CSV file. The limit depends on your licence: “Audit (Standard)” lets you export up to 50,000 records at a time, “Audit (Premium)” up to 1,000,000.

In the exported file, the most important information sits in the “AuditData” column, which is stored in JSON format. It is easy to expand with Excel Power Query: each JSON field becomes a separate column, such as the workspace, report name, operation and the user’s email address.
A few filtering tips:
- When investigating a single incident, start with a narrow time window and a specific user.
- When checking sharing, filter on the sharing and access-granting operations.
- If there are more results than the export limit allows, split the search into shorter periods.
Programmatic access: REST API and PowerShell
Once you need audit data on an ongoing basis, manual exports no longer do the job. Microsoft explains that data can be exported via the Power BI REST API to blob storage or an SQL database, while the PowerShell command Get-PowerBIActivityEvent returns one day’s activity data.
When planning automation, bear these limits in mind:
- Time window. A single REST API request returns up to one hour of data, so collecting a full day requires a loop.
- Request limit. The Get Activity Events API allows up to 200 requests per hour.
- Storage. In Microsoft’s example, each day’s data is saved to a separate JSON file. This is a convenient structure for loading into a Power BI model later.
The collected files can be kept in a SharePoint library, a data warehouse or an SQL database. We discussed when a dedicated warehouse is worthwhile in our article on the Power BI data warehouse. A report built on these files can refresh on a schedule; we covered the settings in our scheduled refresh guide.
How long records are kept and when they appear
According to Microsoft’s documentation, “Audit (Standard)” records are kept for 180 days, while “Audit (Premium)” retention can be longer, depending on the retention policies applied. Six months is often not enough for a year-on-year comparison or an auditor’s query about the previous financial year.
That is why Microsoft recommends starting to extract and store user activity data as soon as possible if you are not doing so already. History that has already gone cannot be recovered.
Records do not appear instantly. Most Power BI events show up within 30 minutes, but the delay can be up to 60 minutes. If you have just shared a report and cannot yet see the record, wait an hour and run the search again.
Putting audit data to practical use
Microsoft’s implementation guidance sets out several ways to use audit data: comparing actual usage with need, finding unused resources, reviewing how data sources are used and investigating potential security issues, such as oversharing.
Here is how that looks for a company analysing Rivilė or Finvalda data:
- Profit report. You can see whether managers actually open the monthly profit and expenses report or whether it sits unused.
- Restaurant chain. You can check that branch managers view only their own branch’s data and that nobody is exporting sales for the whole chain.
- External accountant or consultant. The records show when an external user signed in and what they viewed, so access can be revoked in good time.
- Investigating changes. If figures in a report suddenly change, the log shows who published a new version and when.
The audit log complements preventive measures but does not replace them. Access is restricted by row-level security, and we covered choosing a sharing method in our guide to data sharing in Power BI. If you process personal data, the audit history helps demonstrate who had access: see our article on GDPR and Power BI for more.
Our view
The audit log is at its most valuable when nobody has to open it by hand. We find that companies often only remember the log after an incident, by which time part of the history may already have gone.
So we recommend treating audit data as just another data source, in exactly the same way as Rivilė, Finvalda, SharePoint or Excel. When activity records flow automatically into a Power BI model alongside the financial data, a manager can see in one place both the financial indicators and who is using them.
In our solutions, reports refresh without any extra work from the user. The same principle applies to monitoring: a process configured once, clear roles and regular review. That lets you stay a step ahead rather than dealing with the consequences.
Analitika360
Power BI analytics ready for your business
Analitika360 builds Power BI report packages for Rivilė and Finvalda users: income, expenses, profit, balance sheet, sales, inventory and debts in a single model, with automatic refresh. The Rivilė Basic and Finvalda Basic plans cost €59 a month, and the Rivilė PRO and Finvalda PRO plans €89 a month.
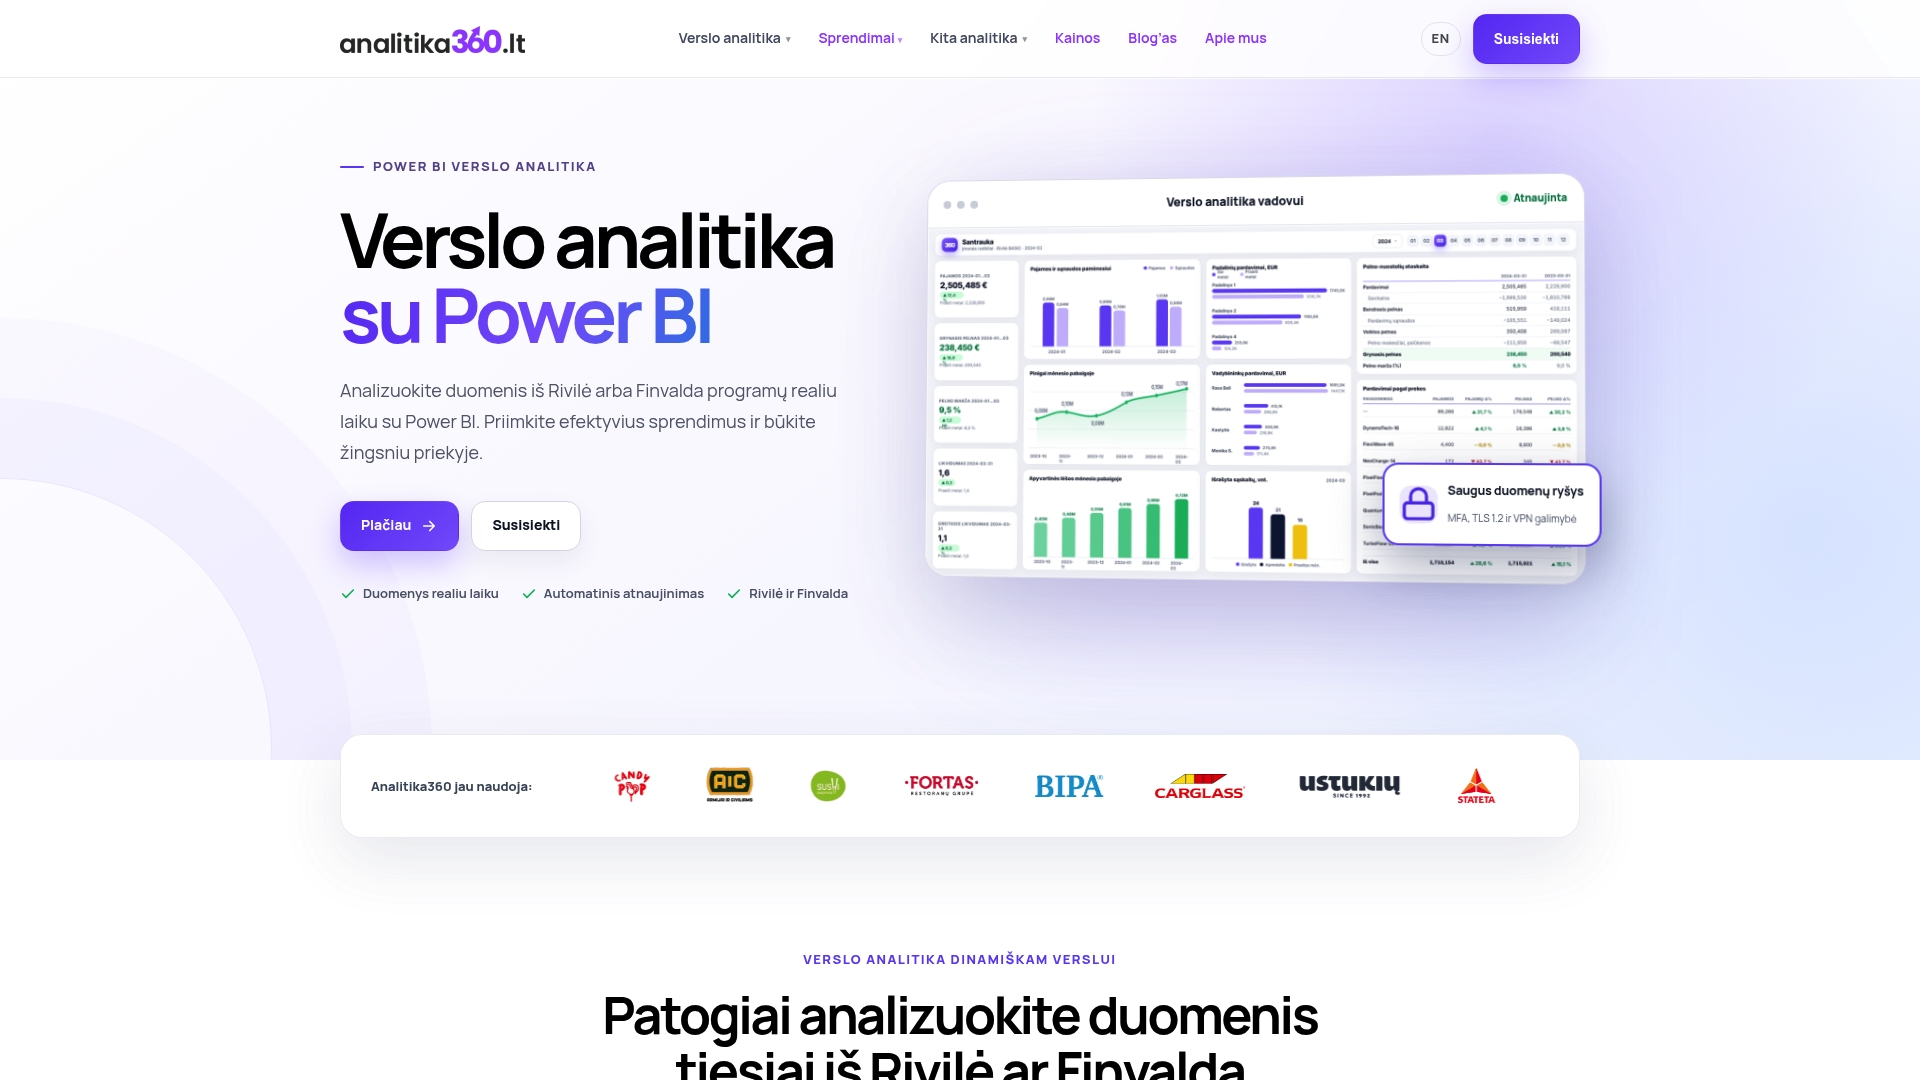
If you need a dedicated audit or usage monitoring report, or integration with SharePoint, CRM or logistics systems, we take on bespoke projects at €70 an hour. We also help you buy Microsoft Pro and Premium licences. You will find all plans and terms on our business analytics pricing page, and a comparison of packages under Rivilė, Finvalda and Power BI packages. Get in touch and we will discuss how your data could work for you.
FAQ
Can Power BI audit logs be viewed without administrator rights?
The Purview audit log requires the “Audit Logs” or “View-Only Audit Logs” role, so an ordinary Power BI user cannot see the records. A Microsoft 365 administrator can assign the role. If you only need to view the records, the view-only role is sufficient.
Why can’t I find an event that happened a few minutes ago?
Most Power BI events appear within 30 minutes, but the delay can be up to 60 minutes. Wait an hour and run the search again. If the record still is not there, check the date range and the selected activities.
How far back can I see old records?
With “Audit (Standard)”, records are kept for 180 days; with “Audit (Premium)”, retention can be longer depending on retention policies. For a longer history, the data must be exported regularly to your own storage.
Can audit data be displayed in a Power BI report?
Yes. Once the data has been collected via the REST API or PowerShell and saved as JSON files or in an SQL database, it can be loaded into a Power BI model. Such a report shows usage trends, unused reports and changes in sharing.
Sources
- Track user activities in Power BI (Microsoft Learn)
- Track user activities in Microsoft Fabric (Microsoft Learn)
- View audit logs (Microsoft Learn)
- Audit log activities (Microsoft Learn)
- View Power Platform admin activity logs in Microsoft Purview (Microsoft Learn)
- Export, configure, and view audit log records (Microsoft Learn)
- Access the Power BI activity log (Microsoft Learn)
- Admin - Get Activity Events (Microsoft Learn)
- Learn about auditing solutions in Microsoft Purview (Microsoft Learn)
- Power BI implementation planning: Auditing and monitoring (Microsoft Learn)