See more. Decide better.
 Purchasing Reports: How to Automate a Power BI Solution from Rivilė and Finvalda

Purchasing reports are automated Power BI reports built from Rivilė or Finvalda data. They show purchase totals, supplier data and cost structure, and refresh themselves without any manual work. They give you standardised KPIs, faster decision-making and time savings for the finance team. The mechanism rests on Power BI scheduled refresh and a data gateway, which move data from the accounting system into a single analytical model.
In brief:
- Before building the report, check that invoice numbers, dates, amounts and supplier identifiers in Rivilė or Finvalda are recorded consistently, as empty fields distort the summaries.
- On shared Power BI capacity, a report can be scheduled to refresh up to eight times a day; for most purchasing needs, one daily refresh is enough for operational decisions.
- If your Rivilė or Finvalda database sits on a company server, you need a data gateway; an enterprise gateway runs independently of any single employee being logged in.
- If staff manually move purchasing data into Excel several times a month, start with a supplier spend or delivery time report.
- Rivilė Basic and Finvalda Basic cost €59 a month, the PRO plans cost €89, and custom projects are charged at €70 an hour.
Contents
- What an effective purchasing report should cover: essential KPIs and dimensions
- The technical side: Power BI data refresh, scheduled refresh and gateway practice
- Practical implementation steps from Rivilė or Finvalda to an automated Power BI report
- Standardised KPIs and a purchasing report template: what to visualise
- Editorial perspective: when automation delivers the most value
- How Analitika360 can help: ready-made packages and custom projects
- FAQ
- Sources
What an effective purchasing report should cover: essential KPIs and dimensions
A purchasing report only makes sense when it has the right metrics and the right structure. First of all, you need total purchase amounts broken down by supplier, category and individual product or SKU. Without this foundation, it is impossible to answer a simple question: where is the money actually going?
The second layer is operational metrics, which show not just how much was spent but how efficiently the purchasing process works:
- average order value and how it changes over the period;
- delivery time from order to goods receipt;
- differences between quantities ordered and delivered;
- the number and frequency of delays by supplier.
The third layer is the dimensions and filters that let the same report serve different users: period, project, department, supplier. The finance director may need a monthly view of the whole company, while a department head needs only their own project’s data, and the same report should serve both without extra work.
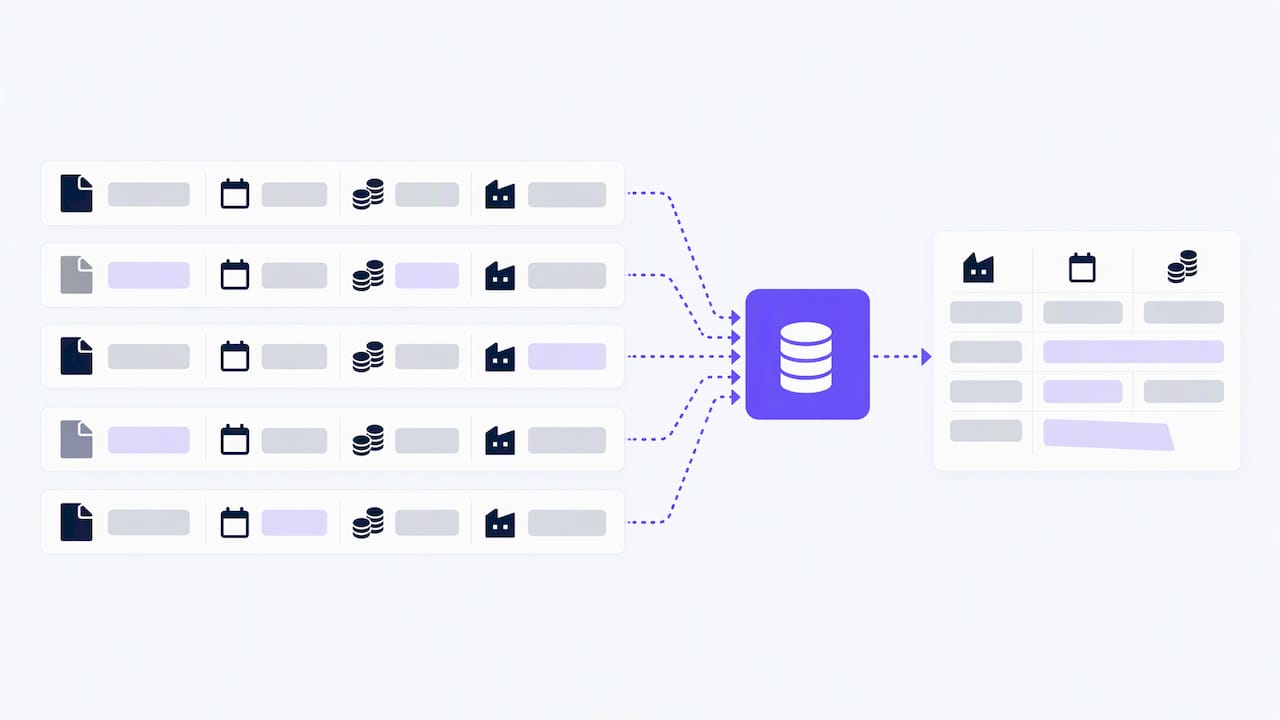
The fourth layer is often the least discussed, yet it determines the accuracy of the whole solution: data quality fields. The invoice number, document date, amount and supplier identifier must be filled in consistently on the Rivilė or Finvalda side, because any empty value in these fields immediately distorts the aggregates in the Power BI model.
Pro tip: before designing visuals, first list which fields in the Rivilė or Finvalda database are currently filled in inconsistently, and fix them before the first refresh.
For more on how to check data quality systematically before implementation, see the data quality checklist.
The technical side: Power BI data refresh, scheduled refresh and gateway practice
The data refresh architecture decides whether a purchasing report will be reliable or merely an attractive one-off export. The first choice is the mode: import mode loads data into the semantic model and requires scheduled refresh, while DirectQuery queries the data source directly every time a user opens the report. Import mode usually suits purchasing data best, as it is faster in visuals and allows more complex calculation formulas.
Import mode has its limits. Microsoft documentation states that shared capacity allows several scheduled semantic model refreshes a day, while Premium or Fabric capacity allows more, because it is governed by resources rather than a fixed number.
The number of scheduled refreshes per day is limited for shared capacity users, and this matters when planning a purchasing report that refreshes several times a day: more about the limits.
A few technical details that most often cause problems during implementation:
- a data gateway is needed when the Rivilė or Finvalda database is local (on premise) or not directly reachable from the internet;
- an enterprise gateway is recommended rather than a personal one, so that refreshes do not fail when one employee is not logged in;
- the most common cause of errors is outdated data source credentials or a gateway that is temporarily down;
- for large purchase history tables, it is worth using incremental refresh, which updates only new data rather than reloading the whole table.
Access control uses row-level security (RLS), which is set up in Power BI Desktop and lets the same model show different slices of data to different users, for example showing a department head only their own department’s purchases. For more on how the gateway works and how to set it up, see the Power BI data gateway overview.
Practical implementation steps from Rivilė or Finvalda to an automated Power BI report
Implementation follows a set sequence, and a skipped step usually only comes to light at the end of the first month, when the figures do not match the accounts.
- Data inventory. List which Rivilė or Finvalda tables hold purchasing data, and check whether the invoice number, date, amount and supplier ID are filled in consistently.
- Data model planning. Design a fact table (purchase transactions) and dimension tables (suppliers, products, periods), assigning each a unique identifier.
- Integrating additional sources. If some data is held in Excel files or SharePoint folders, join it to the accounting data using shared keys.
- Gateway configuration. Install an enterprise gateway, set up the data source credentials and configure the refresh schedule following Microsoft’s guidance.
- Testing. Compare the totals shown in Power BI with the accounting data, run several manual refreshes and check how the system responds to errors.
Pro tip: check the refresh history daily during the first week after go-live, as most credential or gateway problems surface within the first few cycles.
When building such solutions for Rivilė and Finvalda users, we usually find that ready-made report packages shorten implementation time, because the data model and KPI structure are already standardised, while custom projects allow the model to be tailored to a specific company’s processes and existing IT systems. Mobile reports also let you check the purchasing position from your phone.
Standardised KPIs and a purchasing report template: what to visualise
Once the technical foundation is working, the next step is the right structure of visuals. A few metrics that typically form the core of a purchasing report:
- total purchases over time (a monthly time-series chart);
- distribution of spend across suppliers (a matrix or cross-tab chart showing which supplier accounts for the largest share);
- average order value and how it changes;
- average delivery time by supplier;
- the share of late deliveries;
- purchases by category, compared with budget or the previous period.
Filters for period, department and supplier should be available on a single screen, so that a manager can move from the overall picture to a specific supplier in a few clicks.
This structure transfers easily to a board-level report, where the key KPIs are shown on one page. How to do this in practice is described in the board reporting guide.
Editorial perspective: when automation delivers the most value
Automation is worth the investment when you currently key purchasing data by hand from Rivilė or Finvalda into Excel several times a month. If this work recurs regularly, it is worth starting with one or two reports, such as supplier spend and delivery times, rather than trying to build a complete management system at once. Over time, standardised KPIs pay off not through one-off time savings but because decisions across the whole company are based on the same figures.
— Analitika360
How Analitika360 can help: ready-made packages and custom projects
For Rivilė and Finvalda users, we offer ready-made Power BI report packages that refresh automatically, without any further user involvement, and combine accounting data with Excel or SharePoint sources in a single model.
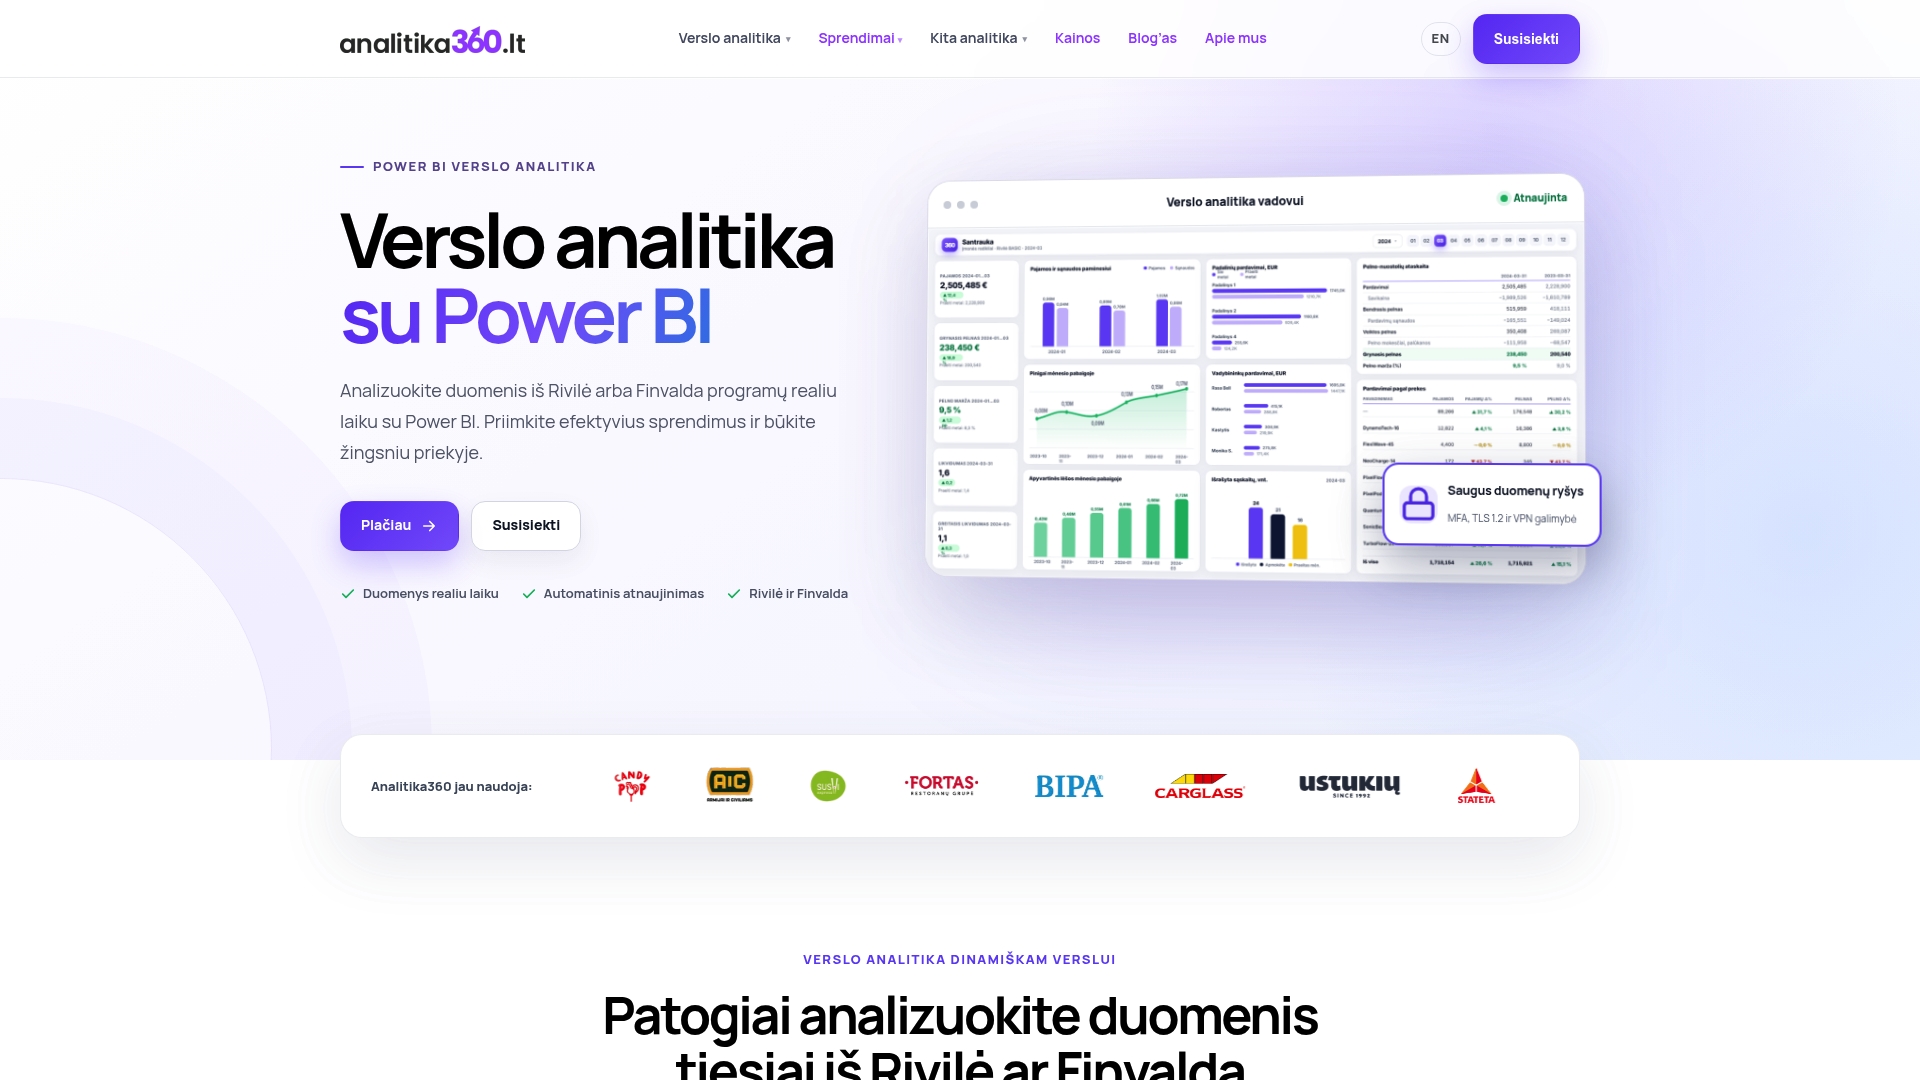
Analitika360 offers plans suited to companies that want to start by tracking purchases, sales and costs, while more advanced plans allow deeper analysis and access to mobile reports. When a standard package does not cover all your needs, a custom project tailors the data model to your company’s processes and existing systems. You can start with the Rivilė Basic package or the Finvalda Basic package, and full pricing is on the business analytics pricing page.
FAQ
How do you build a purchasing report from Rivilė or Finvalda data?
First, purchasing data is collected from the accounting system and a fact and dimension model is designed in Power BI; then the data gateway and refresh schedule are configured. A ready-made report package does this work in advance, so the first results can be available within a few days, while a custom project is tailored to the specific company’s structure.
How often does a Power BI purchasing report refresh?
Refresh frequency depends on the type of Power BI capacity: shared capacity allows up to eight scheduled refreshes a day, while Premium or Fabric capacity allows more frequent refreshes, depending on available resources. Most purchasing reports refresh once a day, as this is enough for day-to-day decisions.
What is a data gateway and when does a purchasing report need one?
A data gateway is software that connects Power BI to a local database, such as a Rivilė or Finvalda server that cannot be reached directly from the internet. It is always needed when the data source is held on the company’s own premises rather than on a cloud platform.
How can purchasing data in a Power BI report be protected from inappropriate access?
Access is restricted through row-level security (RLS), which is set up in Power BI Desktop and lets the same model show different slices of data to different users. This way, a department head sees only their own department’s purchases, even though the same report is used.
How much do automated purchasing reports from Rivilė or Finvalda cost?
The Rivilė Basic and Finvalda Basic plans cost €59 a month, while PRO versions such as Finvalda PRO cost €89 a month. Custom projects are charged at an hourly rate of €70 an hour.