Your business in 360°
Receivables Analysis in Power BI: From Debt Ageing to Collection

Receivables analysis in a Power BI report shows you every morning who owes you money, how long each debt is overdue and whether collection is improving. From that, you can decide whom to call first. The visualisation itself is not the hardest part. The real challenge is getting debt data from Rivilė or Finvalda to refresh on its own, without exporting to Excel. That is why a ready-built report package that connects directly to your accounting system saves the most time. Analitika360 offers Power BI packages of this kind to Rivilė and Finvalda users from €59 a month.
In brief
- Receivables analysis answers four questions: how much money is tied up in debts, who is paying late, by how many days, and whether the situation is improving.
- The foundation is the debt register, payments and sales invoices with payment terms. Rivilė provides these through its API.
- The key metrics are ageing buckets (0–30, 31–60, 61–90, 90+ days), days sales outstanding and the share of overdue debt.
- It is worth keeping supplier debts, supply delays and sales channels in the same model, because they all affect the same cash flow.
- A ready-built Rivilė or Finvalda package removes the most error-prone task: preparing the data by hand.
Contents
- What receivables analysis tells you
- What data you need from Rivilė or Finvalda
- Metrics and visuals in the report
- How to build receivables analysis: five steps
- Supplier debts, supply delays and sales channels
- How to read the results and what to do next
- Ready-built debt report packages for Rivilė and Finvalda
- Our view
- FAQ
- Sources
What receivables analysis tells you
Receivables are amounts owed to you by customers for goods or services you have sold. Analysing them should help you make decisions, not just list who owes what. A good report answers these questions:
- How much money is tied up in debts right now, and how the total has changed since the start of the year.
- Which invoices are overdue and by how many days, broken down by customer, sales manager or department.
- What share of the debt is at risk, i.e. overdue by more than 60 or 90 days.
- Whether collection is improving: are customers paying faster than last quarter?
- Who pays late consistently, rather than just once.
For a restaurant chain, this usually means invoices for events, catering services and business clients. For a wholesaler or a construction company, it is the most important part of working capital. For an accountant, this report makes it possible to answer the managing director in a minute rather than after half a day in Excel.
What data you need from Rivilė or Finvalda
Debts do not appear in the accounts out of nowhere. The Rivilė GAMA guide explains that they arise when purchase and sales transactions are posted and when receivable or payable transactions are entered. If a payment deferral is specified, its days are added to the document date. This leads to a practical rule: if a document has no payment term, the report cannot calculate the days overdue correctly.
For Rivilė ERP users, the Power BI integration guide lists the datasets needed for debt analysis:
- PAYABLE_RECEIVABLES_FLAT: the debt register, i.e. who owes whom and how much;
- PAYMENTS: receipts and payments, showing when an invoice was paid;
- SALES_INVOICE_DETAILED and PURCHASE_INVOICE_DETAILED: sales and purchase invoices with their line items;
- CLIENT: the list of customers and suppliers with their groups.
The same guide states that Power BI connects to Rivilė through a REST API request with a key and a date range, and recommends incremental refresh and a star schema. We have described how this works in practice in our articles on connecting the Rivilė API to Power BI and connecting the Finvalda API to Power BI.
Metrics and visuals in the report
A good receivables report has only a few elements, but each one answers a specific question.
| Metric | What it shows | Suitable visual |
|---|---|---|
| Total debt | How much money is tied up with customers | Card showing the change since the start of the year |
| Ageing buckets | How debts are distributed: current, 1–30, 31–60, 61–90, 90+ days | Stacked column chart |
| Share of overdue debt | What proportion of debt is already past its due date | Percentage card with trend |
| Days sales outstanding (DSO) | How many days it takes on average to collect cash | Line chart by month |
| Customer ranking | Which customers owe the most and for the longest | Table with conditional formatting |
| Customer × days overdue | Where the risk is concentrated | Heat map with drill-down to invoice level |
Days sales outstanding is a classic turnover ratio, also used in Lithuanian financial analysis research. It is calculated by dividing average receivables by sales for the period and multiplying by the number of days in the period. For example, if average receivables over a quarter were €120,000 and sales reached €360,000, then DSO = 120,000 / 360,000 × 90 = 30 days. If your standard payment term is 14 days, customers are paying, on average, twice as late as agreed.
A common mistake is to include invoices that are not yet due in the 1–30 day bucket. Keep current debts in a separate bucket, otherwise overdue debt will look worse than it really is.
How to build receivables analysis: five steps
- Get payment terms in order in your accounting system. Every sales document must have a payment term. Without one, Power BI will calculate days overdue from the document date. Only the accounting team can carry out this step.
- Connect the data directly, without Excel in the middle. A weekly manual export means the report is always out of date and depends on a single person. Analitika360 packages connect to Rivilė and Finvalda, and the reports refresh without any extra work from users.
- Build a star schema. Debt and payment facts are linked to customer, date and department dimensions. Dimensions are the tables you filter by. The most common mistake is a single large flat table in which amounts are duplicated. We cover this in more detail in our star schema guide.
- Calculate days overdue against today’s date. Days overdue must be counted from the due date to today. If they are fixed at the time of refresh, the report is wrong by the very next day. For large volumes of data, use incremental refresh.
- Create views for different users. The managing director needs the total and the trend, a sales manager needs a list of their own customers, and the accountant needs invoice-level detail. In the ready-built Rivilė and Finvalda packages, debt metrics already sit alongside revenue, costs and profit.
Supplier debts, supply delays and sales channels
Receivables analysis shows only half of the cash flow. The other half is payables analysis: how much you have to pay yourself, and when. When both sides are in a single model, you can see whether customer payments will cover upcoming payments to suppliers. In financial analysis, the supplier, customer, their groups and country are used as dimensions, and you can drill down from a total to an individual transaction. This principle is also described in Microsoft’s documentation. We explain how to link this to forecasting in our article on cash flow analysis.
Supply delay analysis requires two dates: the promised delivery date and the actual one. The difference in days, calculated by supplier, shows how often delays occur and how long they last. This data often sits in a logistics system or an Excel spreadsheet. Analitika360 integrates such sources into the same Power BI model as the accounting data.
Sales channel analysis compares revenue, margin and collection speed by channel: online shop, wholesale, events. A channel where sales are growing but DSO is lengthening may be less profitable than its turnover suggests. If channel information is held in a CRM system, CRM and Power BI integration will help.
How to read the results and what to do next
- The 90+ day bucket is growing: review these customers’ credit terms and add them to a priority reminder list.
- DSO is lengthening even though there is little overdue debt: you have most likely granted payment terms that are too long. The fix is commercial, not a matter of debt collection.
- A single customer accounts for a large share of debt: this is concentration risk, which the managing director needs to see separately.
- You pay suppliers faster than you collect from customers: you are financing working capital yourself, so it is worth negotiating terms.
It is worth knowing what the law allows. Under the Law on the Prevention of Late Payments in Commercial Transactions, a creditor who has become entitled to interest may, without separate notice, claim €40 as compensation for recovery costs. The law also regulates payment terms between businesses. For a specific contract or dispute, consult a lawyer.
Ready-built debt report packages for Rivilė and Finvalda
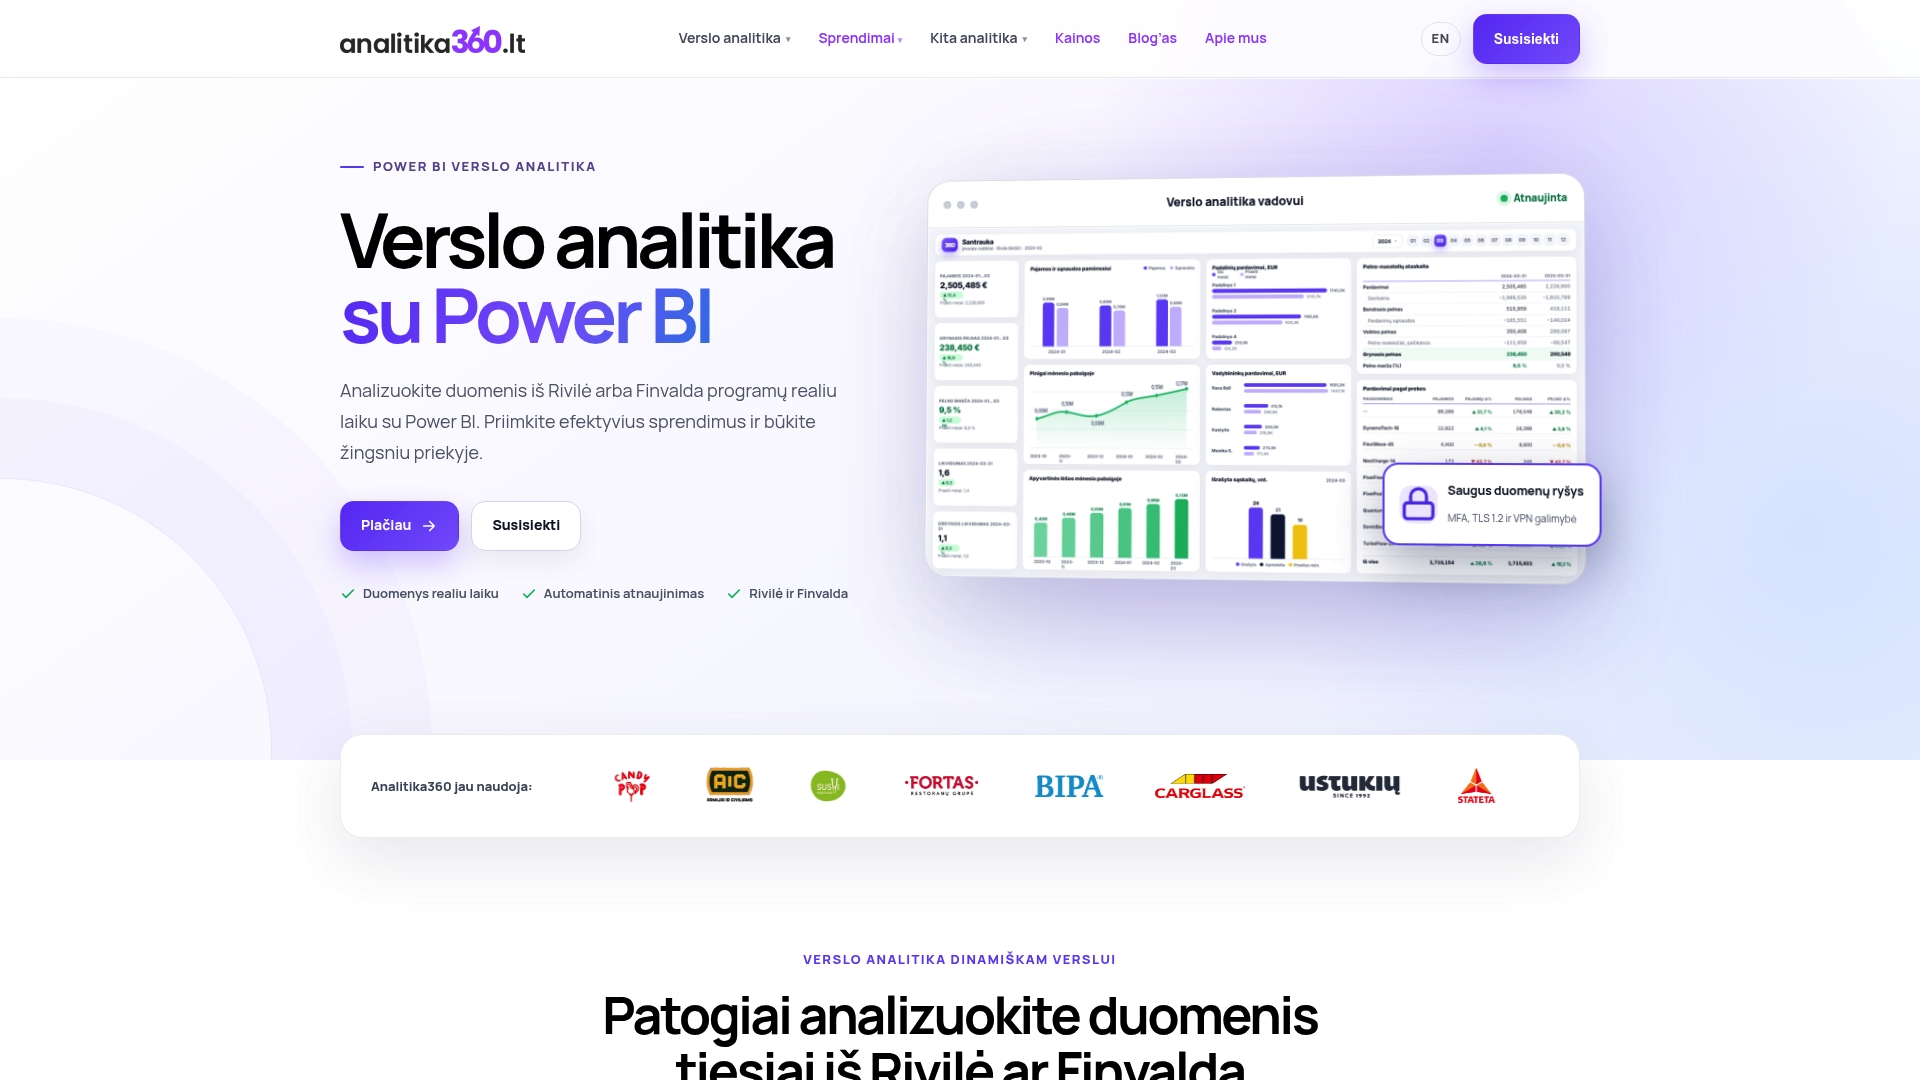
Analitika360 sells ready-built Power BI report packages that show revenue, costs, profit, the balance sheet, sales, inventory and debts in real time. The reports refresh automatically. Rivilė Basic and Finvalda Basic cost €59 a month, while Rivilė PRO and Finvalda PRO cost €89 a month.
If you need to link logistics, CRM or SharePoint data, or create reports tailored to your company’s processes, bespoke projects cost €70 an hour. You can compare all plans on the business analytics pricing page. An example aimed at accountants can be found in our article on Rivilė debt reports.
Our view
Debt reports do not solve problems on their own. Problems get solved when someone sees the report in time and takes action. That is why our first priority is making sure data from Rivilė or Finvalda arrives by itself, so nobody has to be reminded to refresh it.
We always assess receivables alongside revenue, profit and supplier debts. A standalone debt table tells you who is paying late. A combined model shows what that delay means for cash flow and which decision needs to be made today.
Our ready-built packages are designed so that the accountant, finance director or owner has this picture from day one. Time can then go into decisions rather than into preparing reports.
Analitika360
FAQ
Do you need a developer for receivables analysis in Power BI?
If you build the model yourself, you will need to know how to connect to an API, how to model data and how to write DAX formulas. A ready-built Rivilė or Finvalda package has this work done already: you see the metrics, and refreshes happen automatically.

Which ageing buckets suit most companies?
The most common are current debts, 1–30, 31–60, 61–90 and more than 90 days. If your payment terms are short, for example 7 days, the first bucket can be split more finely.

Can you see receivables and payables in a single report?
Yes, and it is recommended. Rivilė provides a combined debt register, so both sides fit into a single model, with the impact on cash flow visible alongside.
Can sales managers view the Power BI report too?
Yes. The report can be shared with your team, and each user can be given the view they need. Sharing reports requires Microsoft licences, which Analitika360 can also provide.
Sources
Customer debt analysis, Rivilė GAMA guide For analytics, reporting and data export, Rivilė ERP guide Financial insights, Microsoft Learn Turnover ratios, Mykolas Romeris University Law on the Prevention of Late Payments in Commercial Transactions, e-seimas