Your business in 360°
Restaurant P&L in Power BI: KPIs, Data and Automated Reports

A restaurant P&L (profit and loss statement) in a Power BI dashboard shows how much of every euro earned is left after food, labour, premises and other costs. You can see it every week, by restaurant and by period, without waiting for the month-end Excel spreadsheet. A dashboard like this is most useful when it pulls data straight from the accounting software and refreshes without manual work. That is exactly what Analitika360 does for Rivilė and Finvalda users: ready-built Power BI report packages show revenue, costs and profit, while other sources, such as Excel or SharePoint, are combined into a single model.
In brief
- A restaurant P&L differs from a standard profit and loss statement in that food, labour and delivery commission costs are shown on separate lines.
- The most important figure is prime cost (food cost + all labour costs). For a full-service restaurant, a healthy target is 60–65% of net sales.
- Calculate every percentage from sales excluding VAT; otherwise the figures look better than they really are.
- The value of Power BI comes from comparisons by period, location, hour and budget, not from a single summary table.
- A report assembled by hand every month arrives late and contains errors. Automatic refresh from Rivilė or Finvalda solves this problem.
Contents
- How a restaurant P&L differs from a standard profit and loss statement
- Which KPIs to show on a restaurant P&L dashboard
- Where to get the data and how to combine it
- How to calculate the KPIs in Power BI
- Comparisons by period, location and hour
- Mistakes that distort a restaurant P&L
- Our view
- Ready-built restaurant P&L packages for Rivilė and Finvalda users
- FAQ
- Sources
How a restaurant P&L differs from a standard profit and loss statement
The statutory profit and loss statement shows the company’s result, but a restaurant manager needs a different picture. A restaurant P&L is a monthly report in which cost of sales and operating expenses are deducted from net sales, and food, labour and channel costs, such as delivery platform commissions, are shown separately rather than buried in general expenses.
That is why a restaurant Power BI dashboard usually has three layers:
- Revenue by channel: dine-in, takeaway, delivery, events. Also by category: food, drinks, other income.
- Prime cost: food and drink cost of sales plus all labour costs.
- Other costs and the result: premises, utilities, marketing, commissions and, finally, net profit.
If you want to see the accounting side in more detail, see our article on accounting reports in Power BI. Finvalda users will also find the guide on how to prepare a Finvalda profit report useful.
Which KPIs to show on a restaurant P&L dashboard
A good dashboard shows every line both in euros and as a percentage of revenue. It is the percentages that let you compare a quiet February with a busy December.
| KPI | How it is calculated | Benchmark |
|---|---|---|
| Net sales | Sales excluding VAT, less discounts | Base for all percentages |
| Food cost % | Cost of ingredients / sales excluding VAT × 100 | Assessed according to the concept |
| Labour cost % | Wages, management salaries, payroll taxes, holiday pay accrual / sales | 30–38% for a full-service restaurant |
| Prime cost % | (Cost of sales + labour) / sales | 60–65% for full service, 55–60% for quick service |
| Occupancy cost % | Rent and related charges / sales | Monitored monthly |
| Net profit margin | Net profit / sales | 5–10% for an independent full-service restaurant |
Separating controllable from non-controllable costs also matters. If controllable costs (ingredients, the staff rota) are in order and profit is still low, the cause is most likely structural: rent that is too high or revenue per square metre that is too low.
Example: one month in figures
Suppose a restaurant’s monthly net sales excluding VAT are €60,000.
- Food and drink cost of sales: €18,000 (30%)
- Labour costs including taxes: €19,800 (33%)
- Prime cost: €37,800 (63%)
- Premises: €5,400 (9%)
- Other operating costs and commissions: €10,800 (18%)
- Net profit: €6,000 (10%)
If labour costs rise to 36%, prime cost becomes 66% and profit falls to €4,200. Just a few percentage points account for almost a third of the profit, which is why prime cost is worth tracking every week rather than once a quarter.
Where to get the data and how to combine it
A restaurant P&L rarely lives in a single system. Sales come from the till (POS), costs and VAT from the accounting software, working hours from the rotas, and the budget often from Excel. The data is prepared as follows:
- The accounting foundation. Rivilė or Finvalda is the most reliable source for costs, cost of sales and profit, because the documents are already entered there. Analitika360 report packages take this data directly and refresh it automatically.
- Sales detail. Data at the level of hours, dishes and channels usually sits in the till system. We explain how to plan this in our guide to POS and Power BI implementation.
- Additional sources. Budgets, staff rotas and lists of locations are often kept in Excel or SharePoint. How to combine Rivilė, Excel and Power BI into one model is covered in a separate article.
- Shared reference lists. All sources must use the same list of restaurants, categories and dates. Otherwise the comparisons will not work.
The most common mistake at this stage is giving the same thing different names, for example “Vilnius centras” in the till system and “VLN-1” in the accounts. Analitika360 bespoke projects are tailored to the company’s processes and existing IT systems, so mappings like these are sorted out during implementation.
How to calculate the KPIs in Power BI
Power BI KPIs are built with DAX measures. The simplest set looks like this:
Grynieji pardavimai = SUM(Pardavimai[SumaBePVM])
Savikaina = SUM(Savikaina[Suma])
Darbo sanaudos = SUM(Darbas[Suma])
Prime cost % = DIVIDE([Savikaina] + [Darbo sanaudos], [Grynieji pardavimai])
Grynojo pelno marza = DIVIDE([Grynieji pardavimai] - [Visos sanaudos], [Grynieji pardavimai])
DIVIDE prevents errors when a period has no sales, for example when the restaurant is closed. Suitable visuals include:
- Cards with prime cost % and net profit margin at the top.
- A waterfall chart showing the path from sales to profit.
- A line chart with the weekly trend and a target line.
- A matrix with P&L lines as rows and restaurants as columns.
Comparisons by period, location and hour
A dashboard becomes a management tool when it answers the question “compared with what?”.
- Period: this month, last month and the same month last year. A date table with DAX time intelligence functions lets you show this in a single click.
- Location: for a restaurant chain this is the most important view. A master’s thesis at Vytautas Magnus University (VDU) analysing restaurant performance found that labour costs were higher at the Vilnius branch, while labour at the Kaunas restaurant was more productive. Differences like these only become visible when branches are shown side by side.
- Hour and day: sales per hour alongside working hours show when a shift is over- or understaffed. We cover this in more detail in our article on restaurant sales analysis.
- Budget versus actual: when the ingredient and labour blocks are budgeted as a percentage of turnover, variances are visible straight away. We explain how to do this in our guide to budget comparison in Power BI.
Mistakes that distort a restaurant P&L
- Percentages calculated on VAT-inclusive prices. In Lithuania, catering services are subject to 21% VAT, so the menu price must be divided by 1.21. A dish priced at €14 is €11.57 excluding VAT. If you calculate food cost against €14, the percentage will look artificially good.
- Only gross wages in labour costs. The labour line must include hourly and management wages, payroll taxes, insurance and benefits. Otherwise the true cost of labour is considerably higher than the report shows.
- Delivery commissions in general expenses. This makes the delivery channel look more profitable than it is.
- Manual refresh. When a report is pieced together from export files, it reaches the manager too late and often contains errors. We discussed scheduled refresh settings in our article on Power BI scheduled refresh.
- No control totals. The revenue and cost totals on the dashboard must agree with the accounting software every month. It is worth building this check into the report itself.
Our view
A restaurant owner does not need yet another spreadsheet. They need a figure they can trust on Monday morning, when the week’s rota and orders are being planned.
That is why we start with the accounting data in Rivilė or Finvalda, not with attractive visuals. When the P&L rests on the same documents the accountant maintains, there are no more arguments about whose figure is right. When the report refreshes without any extra work from the user, it turns from a month-end ritual into an everyday tool.
Restaurant chains and accountants using our system save time and get comprehensive financial information for strategic decisions. For a restaurant, this means prime cost, labour costs and profit for each location are visible while there is still time to change something.
Analitika360
Ready-built restaurant P&L packages for Rivilė and Finvalda users
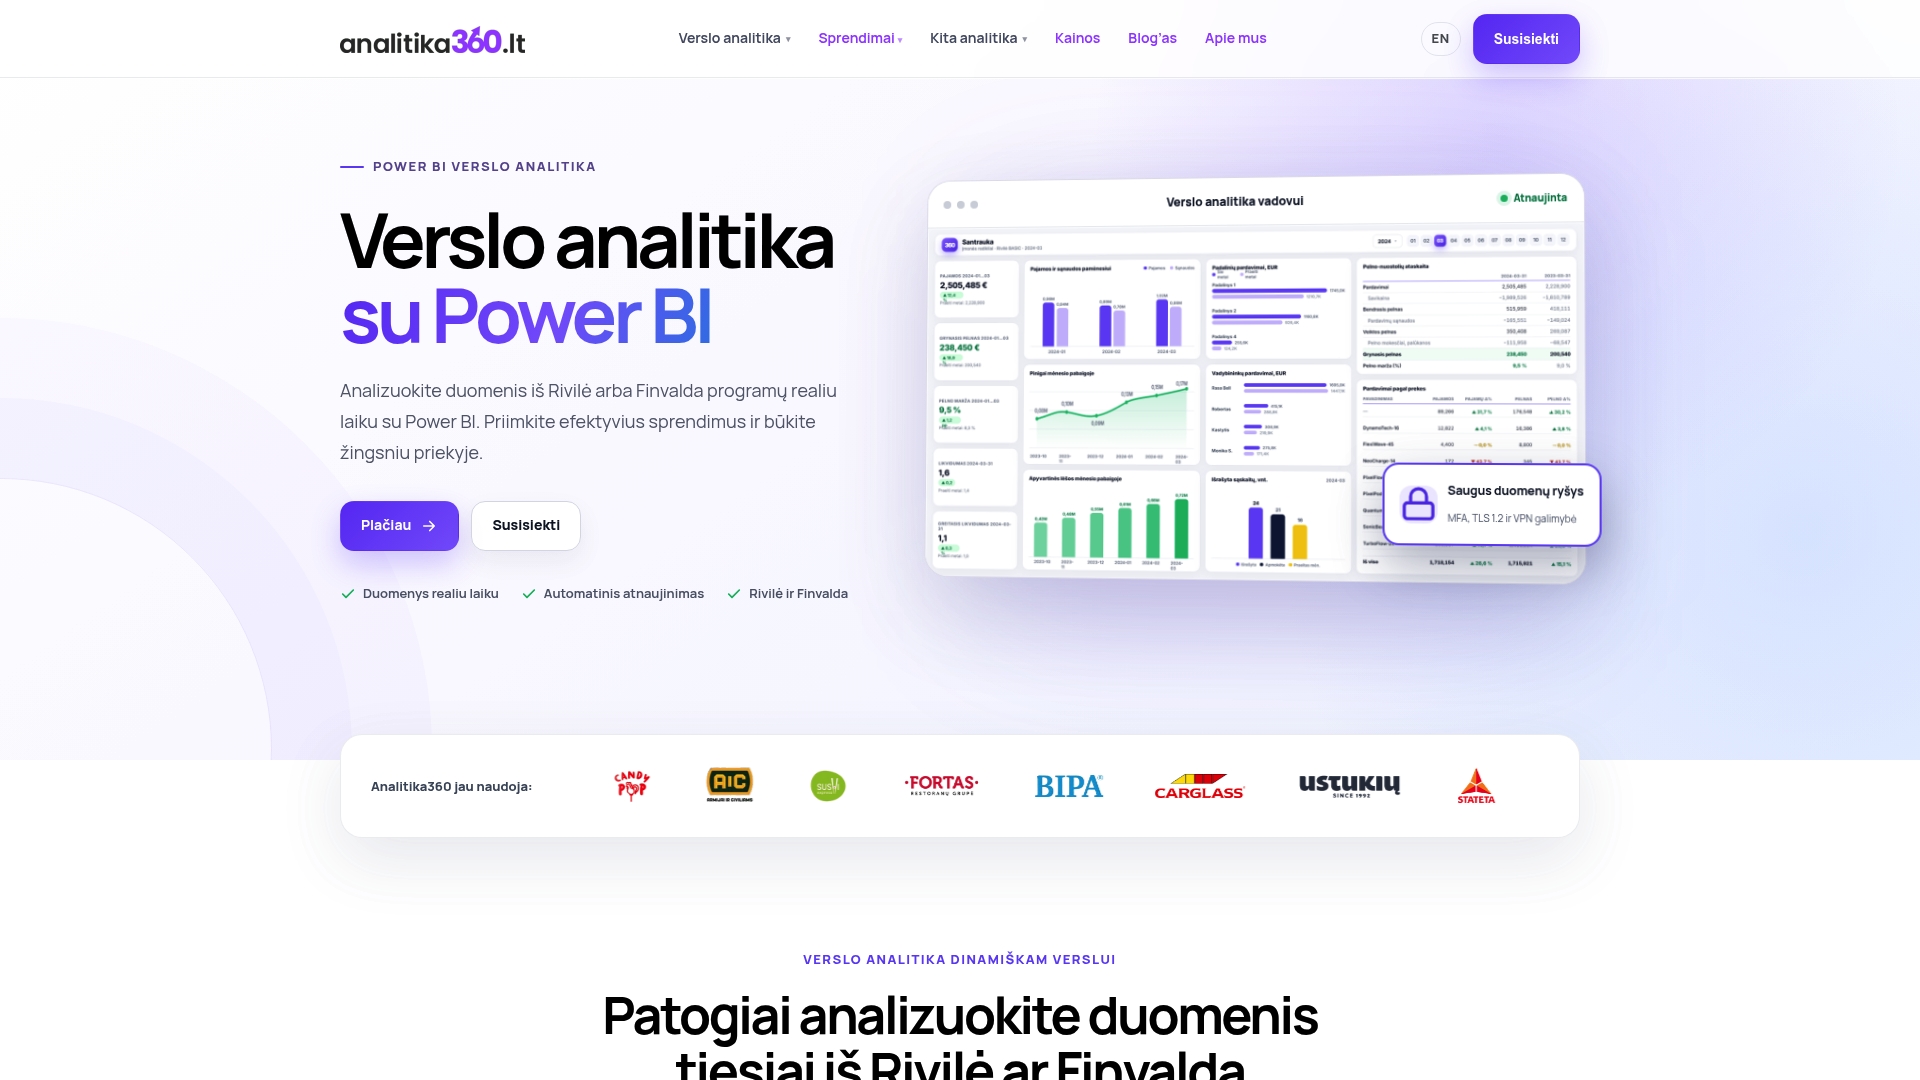
Analitika360 offers ready-built Power BI report packages that show revenue, cost, profit, inventory and debt KPIs and refresh automatically. The Rivilė Basic and Finvalda Basic plans cost €59 a month, and Rivilė PRO and Finvalda PRO cost €89 a month. Sector-specific reports are prepared for restaurants.
If you need to combine till, Excel or SharePoint data with the accounts and tailor the P&L to the structure of your restaurants, bespoke projects cost €70 an hour. Compare plans and terms on the business analytics pricing page or start with the Rivilė Basic package or the Finvalda Basic package.
FAQ
How does a restaurant P&L differ from the profit and loss statement?
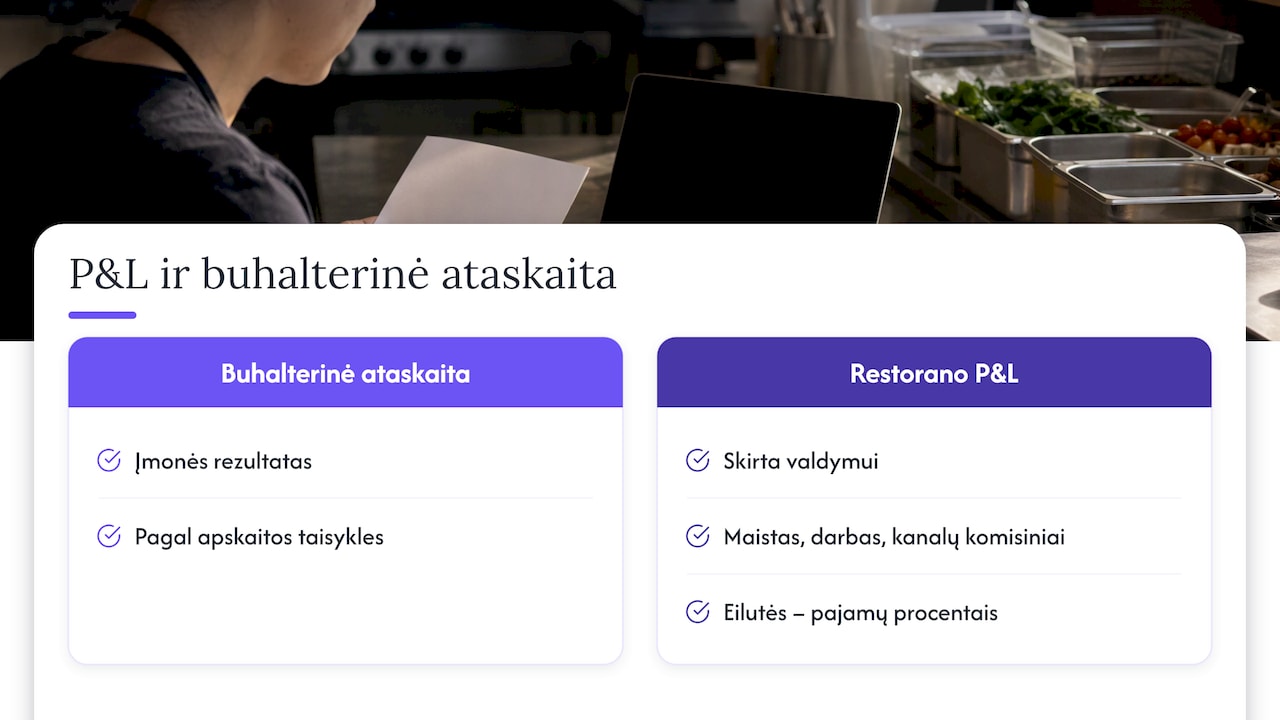
The statutory statement shows the company’s result according to accounting rules. A restaurant P&L breaks the same data down for management: food cost, labour and channel commissions are shown separately, and every line is expressed as a percentage of revenue.
What prime cost is considered healthy?
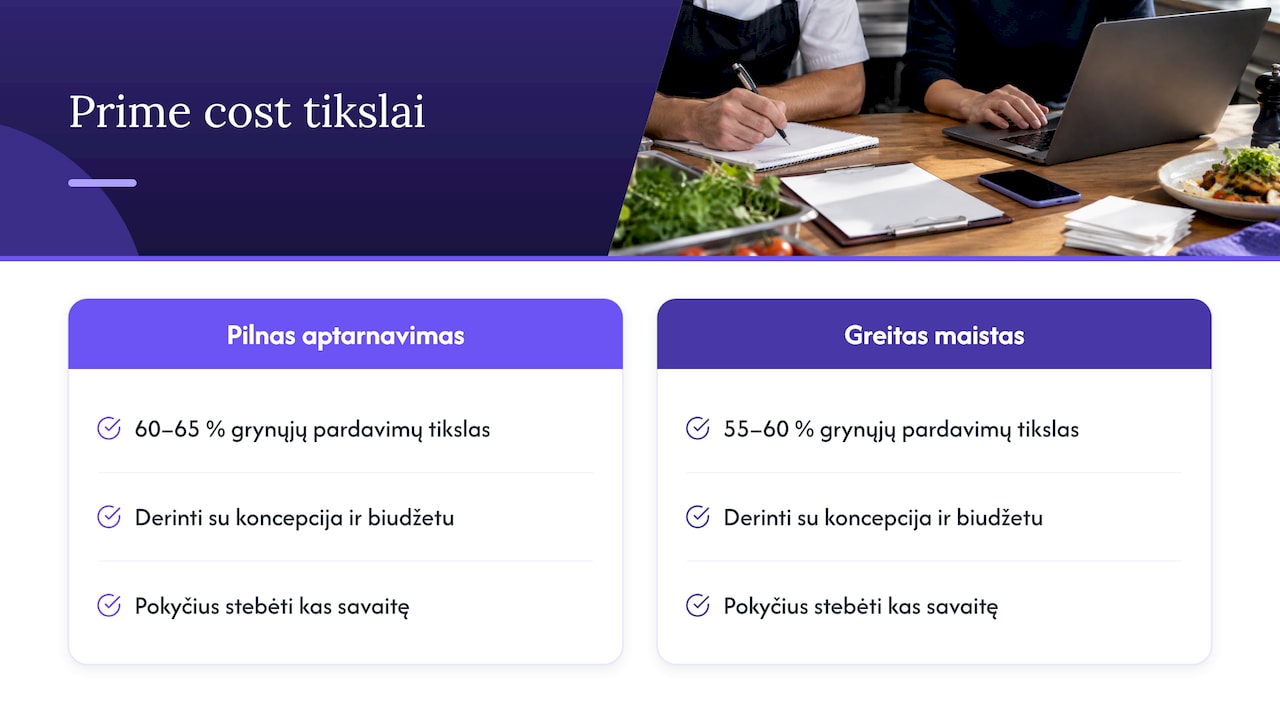
For full-service restaurants the target most often cited is 60–65% of net sales, and 55–60% for quick service. It is worth linking the target to your own concept and budget and tracking changes every week.
Is a Power BI P&L suitable for a single restaurant, or only for a chain?
It suits both. For a single restaurant, the most important comparisons are by period, hour and budget. A chain also sees the differences between locations, which is usually where the biggest savings lie.
How often is the data refreshed?
Analitika360 reports refresh automatically, with no extra input from the user. The exact frequency depends on the package chosen and the Power BI licence. Microsoft Pro and Premium licences can also be purchased through Analitika360.
Do I need to know DAX to use a dashboard like this?
No. In the ready-built packages the measures have already been created, so the user simply filters and reads the results. DAX knowledge is only needed when a report is built from scratch.
Sources
Patron Accounting: How to Build a Restaurant P&L Statement Step by Step Restaurant Bottom Line: The Restaurant Financial Model Restaurant Bottom Line: The Best Restaurant P&L Template for Independent Operators VDU: Assessing and optimising employee productivity Food cost: how to calculate it in a restaurant