Your business in 360°
Supplier SLA Analysis: Metrics, Formulas and a Power BI Report

Supplier SLA analysis shows whether a supplier is actually delivering what it promised in the contract: whether the service was available, whether incidents were responded to on time and whether orders arrived by the agreed deadline. For the analysis to be reliable, you need three things: clearly defined metrics with formulas, agreed targets and breach rules, and data that refreshes on its own and can be viewed by supplier, period and priority. This guide covers all three, along with a practical plan for building such a report in Power BI.
In brief
- An SLA is an agreement between buyer and supplier on the minimum level of service quality, so analysing it starts with the metrics written into the contract, not with opinions.
- Key metrics: availability, response and resolution time compliance, MTTR, on-time delivery and fill rate.
- Targets are set on the basis of historical data, and reporting frequency depends on how critical the supplier is: more often for critical suppliers, less often for tactical ones.
- The analysis must distinguish a one-off incident from a systemic problem, so it pays to compare results by time, priority and cause.
- Power BI lets you combine data from your accounting system, Excel and other systems into a single SLA report that refreshes automatically.
Contents
- What a supplier SLA is and what it should define
- Which supplier SLA metrics to track
- Targets, reporting period and breach rules
- How to analyse supplier SLA results
- An SLA report in Power BI: data, visuals and filters
- Our approach
- How we help you build a supplier SLA report
- FAQ
- Sources
What a supplier SLA is and what it should define
A study carried out in Lithuania describes an SLA as an agreement between the buying company and the supplier on the minimum quality of service needed to meet a business need. In practice, Lithuanian suppliers word such agreements very precisely: Telia, for example, sets out in its SLA description for business customers the service availability, the maximum response time and its liability if commitments are not met.
For an SLA to be analysable, every commitment needs four elements:
- A measurable metric, such as availability as a percentage or response time in hours.
- A measurement period: a month, a quarter or a week.
- A specific threshold below which the result counts as a breach.
- Consequences: a warning, a service credit, a corrective action plan or another remedy set out in the contract.
If even one element is missing, the report will show figures but will not answer the key question: did the supplier fulfil the contract?
Which supplier SLA metrics to track
The set of metrics depends on what the supplier provides. For IT and telecoms services, availability and incident management matter most; for goods suppliers and logistics, it is on-time delivery and order fulfilment. A good example is the EETS service quality indicators annex from Via Lietuva, the Lithuanian state road management company: it assesses the provider on data transmission error rate, system availability, data accuracy, stability, regulatory breaches and customer satisfaction, with a minimum availability level of 99.2% and a target of 99.8%.
| Metric | How to calculate | Suitable for |
|---|---|---|
| Availability | (net service time − unplanned downtime) / net service time × 100 | IT systems, telecoms, software |
| Response time compliance | incidents meeting the response SLA / all incidents × 100 | Support and maintenance services |
| Resolution time compliance | incidents resolved within the SLA deadline / all incidents × 100 | Support, servicing |
| MTTR (mean time to restore) | total restoration time / number of incidents | Critical systems |
| On-time delivery | orders delivered on time / all orders × 100 | Goods suppliers, logistics |
| Fill rate | quantity delivered / quantity ordered × 100 | Goods supply, warehousing |
Example: in a 30-day month the service should have run for 720 hours, and unplanned downtime lasted 3 hours. Availability: (720 − 3) / 720 × 100 = 99.58%. If the contract had the same thresholds as the Via Lietuva document, the supplier would exceed the minimum level but miss the target. If, in the same month, 46 of 50 incidents received a response on time, response compliance is 92%, and if restoring all 50 incidents took 150 hours, MTTR equals 3 hours.
Priority matters for incident metrics. In Telecentras’s IT service terms and conditions, priority is determined by impact and urgency levels, and response and resolution times depend on priority. So in your report, always calculate response compliance separately for each priority: an average can hide the fact that critical incidents are being resolved too slowly.
Targets, reporting period and breach rules
Metrics without targets are just statistics. When setting targets, follow a few principles:
- Base them on historical data. If a supplier currently delivers 80% of orders on time, a 99% target will be a permanent breach from the first month rather than a management tool. It is better to set a realistic level and raise it in stages.
- Choose the frequency according to criticality. Critical suppliers merit a weekly report, a monthly one is enough for tactical suppliers, and the SLA terms themselves for critical services are usually reviewed quarterly.
- Use common market benchmarks. In Best Buy’s supplier direct fulfilment programme, for example, the targets are a 99% adjusted fill rate and 95% on-time deliveries.
- Define exceptions. Force majeure events and delays caused by the customer itself should be flagged in the data and excluded from the supplier’s result.
- Agree an escalation sequence. The usual order is: a warning and a discussion of the root cause, corrective action, a management review and, as a last resort, changing or terminating the contract terms.
Before signing the contract, also check how incidents are logged, from what point the response time is counted and whether you will be able to obtain the data in a structured format. This determines whether the SLA report can be automated.
How to analyse supplier SLA results
The FACIS SLA governance methodology recommends combining continuously collected metrics with periodic reports that show deviations, root cause analysis, corrective actions and trends. This helps distinguish a one-off incident from a systemic problem. In practice, it is worth carrying out the analysis in this order:
- Compare the result with the target and the minimum threshold for each supplier and metric.
- Look at the trend over at least 6–12 months: one bad month and three consecutive months of deteriorating results call for different actions.
- Break it down by priority, service and department. The problem often lies in a single service or a single location.
- Look for recurring patterns: the same causes, days of the week, month-end peaks or a particular product.
- Assess the business impact: what the downtime, late deliveries or extra work cost.
- Record the actions: the root cause, the person responsible, the corrective action and its deadline.
Northern Ireland’s business information portal stresses that supplier performance reviews help track KPI and SLA compliance, spot gaps early and agree corrective actions, and that their frequency should match the service and business risk. Supplier SLA analysis naturally ties into the wider purchasing picture, so it is worth linking it to purchasing reports in Power BI: that way you see not only service quality but also how much you pay each supplier.
An SLA report in Power BI: data, visuals and filters
A Power BI SLA dashboard is only as good as its data. So start with the model, not the charts.
Data model
A minimal SLA model consists of:
- A fact table of incidents, orders or deliveries: logging, response and resolution times, priority, status, cause.
- A suppliers table: name, category, criticality, contract number, account manager.
- An SLA thresholds table: the minimum level and target for each supplier and priority. Thresholds are kept separately so that changing them does not mean rewriting formulas.
- A date table, so you can compare months, quarters and years.
- Financial data from the accounting system, such as Rivilė or Finvalda: purchase amounts, invoices, credit notes.
Incident data often lives in Excel or SharePoint lists, and order data in accounting or logistics systems. Power BI joins them on the supplier code, so supplier codes must be identical across all systems. This is the same work we describe in our article on KPI and report standardisation.
Pages and visuals
- Management overview: KPI cards showing each metric’s result and target, colour-coded breaches and a supplier ranking.
- Trends: a monthly line chart with a target line, so any deterioration is visible at once.
- Incident detail: a table by priority with response and resolution times, MTTR and the number of breaches.
- Root cause analysis: a bar chart by cause and category, so you can see what keeps recurring.
- Action log: open corrective actions, owners and deadlines.
Filters needed in almost every SLA report: period, supplier, supplier category and criticality, priority, service or product, and department. For logistics suppliers, route or warehouse will also be useful; we cover related metrics in our guides to transport cost analysis and supply chain reports.
Refresh and data quality
An SLA report that is refreshed by hand soon goes out of date. In the Power BI service you can set up scheduled refresh: Power BI Pro allows up to 8 refreshes a day, and Premium up to 48. A few refreshes a day are enough for most supplier SLA reports, while a more frequent cycle is worth considering for critical services. We explain how to set up the whole process in our guide to automatic report refresh.
Check data quality at the Power Query stage. The data profiling tools described by Microsoft show column statistics, distribution and row counts, so you will quickly spot blank response dates, duplicates or incorrect priorities. Add a few control rules on top: the resolution time cannot be earlier than the logging time, every incident must have a supplier and a priority, and exceptions must be flagged in a separate field.
Our approach
Most of the companies we work with already have SLA data: incident lists in Excel, orders in Rivilė or Finvalda, contract terms in SharePoint. What is missing is not data but a single model where it all comes together.
That is why we start with the accounting data. When SLA results sit alongside purchase amounts, payables and costs, the conversation with the supplier becomes concrete: you see not only how many times they were late, but also what it cost your business.
The second principle: the report must refresh without human intervention. Our solutions are built so that data from Rivilė, Finvalda and other sources reaches Power BI automatically, and the finance manager or purchasing specialist spends their time on decisions rather than copying spreadsheets.
Analitika360
How we help you build a supplier SLA report
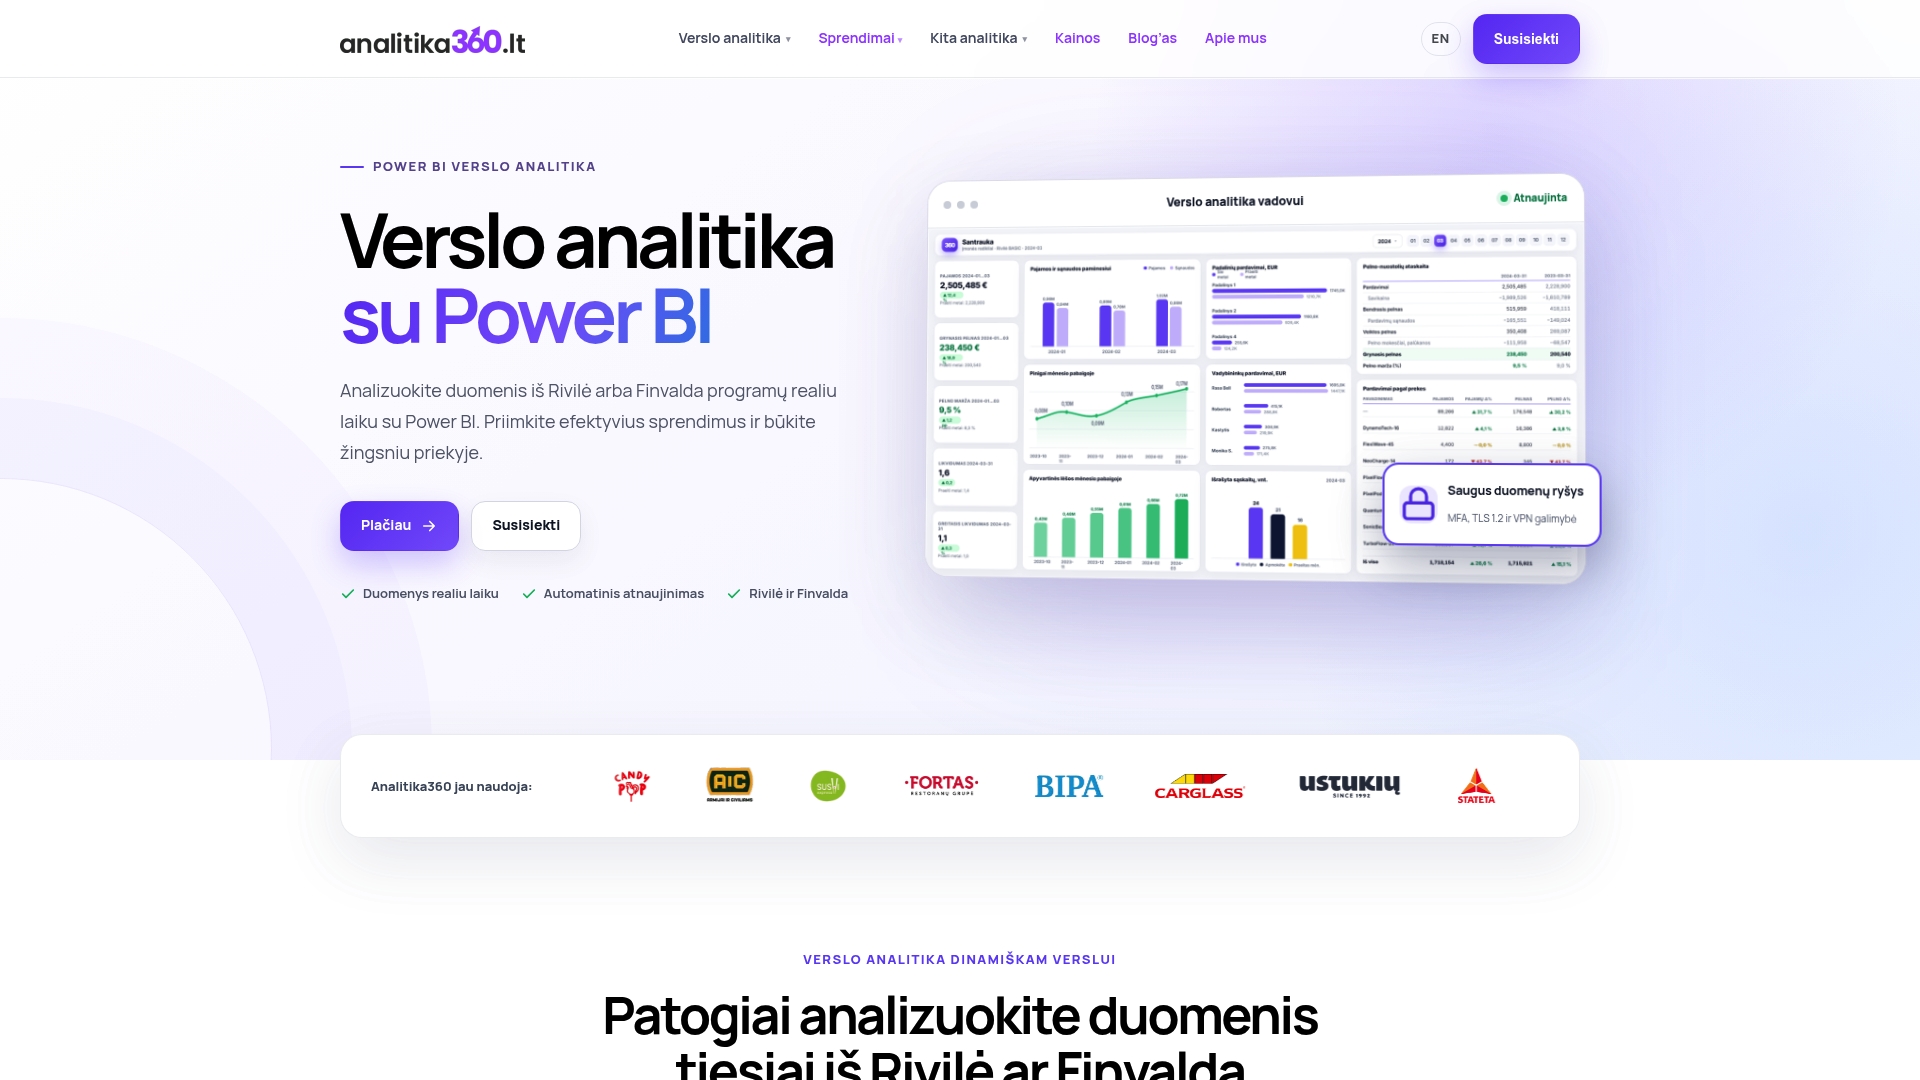
Analitika360 builds Power BI reports for Rivilė and Finvalda users and integrates other sources: Excel, SharePoint, CRM or logistics systems. A supplier SLA report is usually built as a bespoke project, tailored to your contracts, metrics and existing IT systems.
- Rivilė Basic and Finvalda Basic: €59 a month.
- Rivilė PRO and Finvalda PRO: €89 a month.
- Bespoke projects: €70 an hour.
We also help you purchase the Microsoft Power BI Pro and Premium licences you need. You will find full terms on our business analytics pricing page, and an overview of the ready-built packages on the page about Rivilė, Finvalda and Power BI packages. Get in touch and let’s discuss which SLA metrics your company needs.
FAQ
What is the difference between an SLA and a KPI?
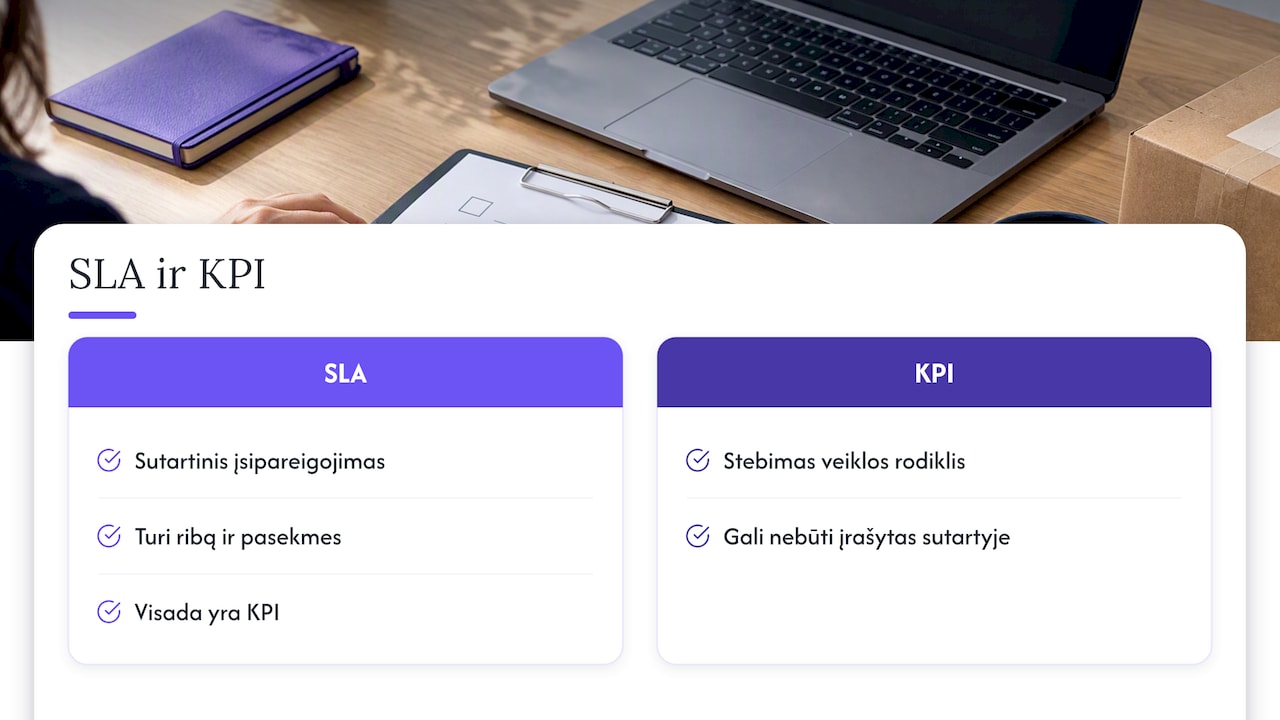
An SLA is a contractual commitment with a threshold and consequences, while a KPI is any performance metric you track. All SLA metrics are KPIs, but not every KPI is written into a contract. It is worth showing them together in the report, clearly marking which ones carry contractual consequences.
How often should supplier SLA results be reviewed?
For critical suppliers, results are worth monitoring weekly; for tactical ones, monthly. The SLA terms themselves for critical services are usually reviewed quarterly, and for less critical ones every six months or once a year. An automatically refreshing report lets you see deviations between reviews as well.
Does a Power BI SLA report need a dedicated incident management system?
Not necessarily. A structured list of incidents or orders with dates, priority and supplier is enough, and it can sit in an Excel or SharePoint file. What matters most is that the fields are filled in consistently and that supplier codes match the accounting system.
How should incidents caused by the customer itself be handled?
Such cases should be defined in the contract as exceptions and flagged in the data in a separate field. In Power BI they can be filtered out so that the supplier’s result is calculated correctly. This avoids disputes during reviews.
Sources
- VDU (Vytautas Magnus University): study on buyer–supplier SLAs
- Telia: service level agreement (SLA)
- Via Lietuva: EETS service quality indicators
- Telecentras: IT service terms and conditions
- Best Buy: supplier SLA requirements
- FACIS: SLA Governance Framework Playbook
- nibusinessinfo.co.uk: reviewing supplier performance
- Microsoft Fabric Community: configuring scheduled refresh
- Microsoft: data profiling in Power Query