Your business in 360°
Rivilė and Finvalda Data Replication: The Route to Power BI

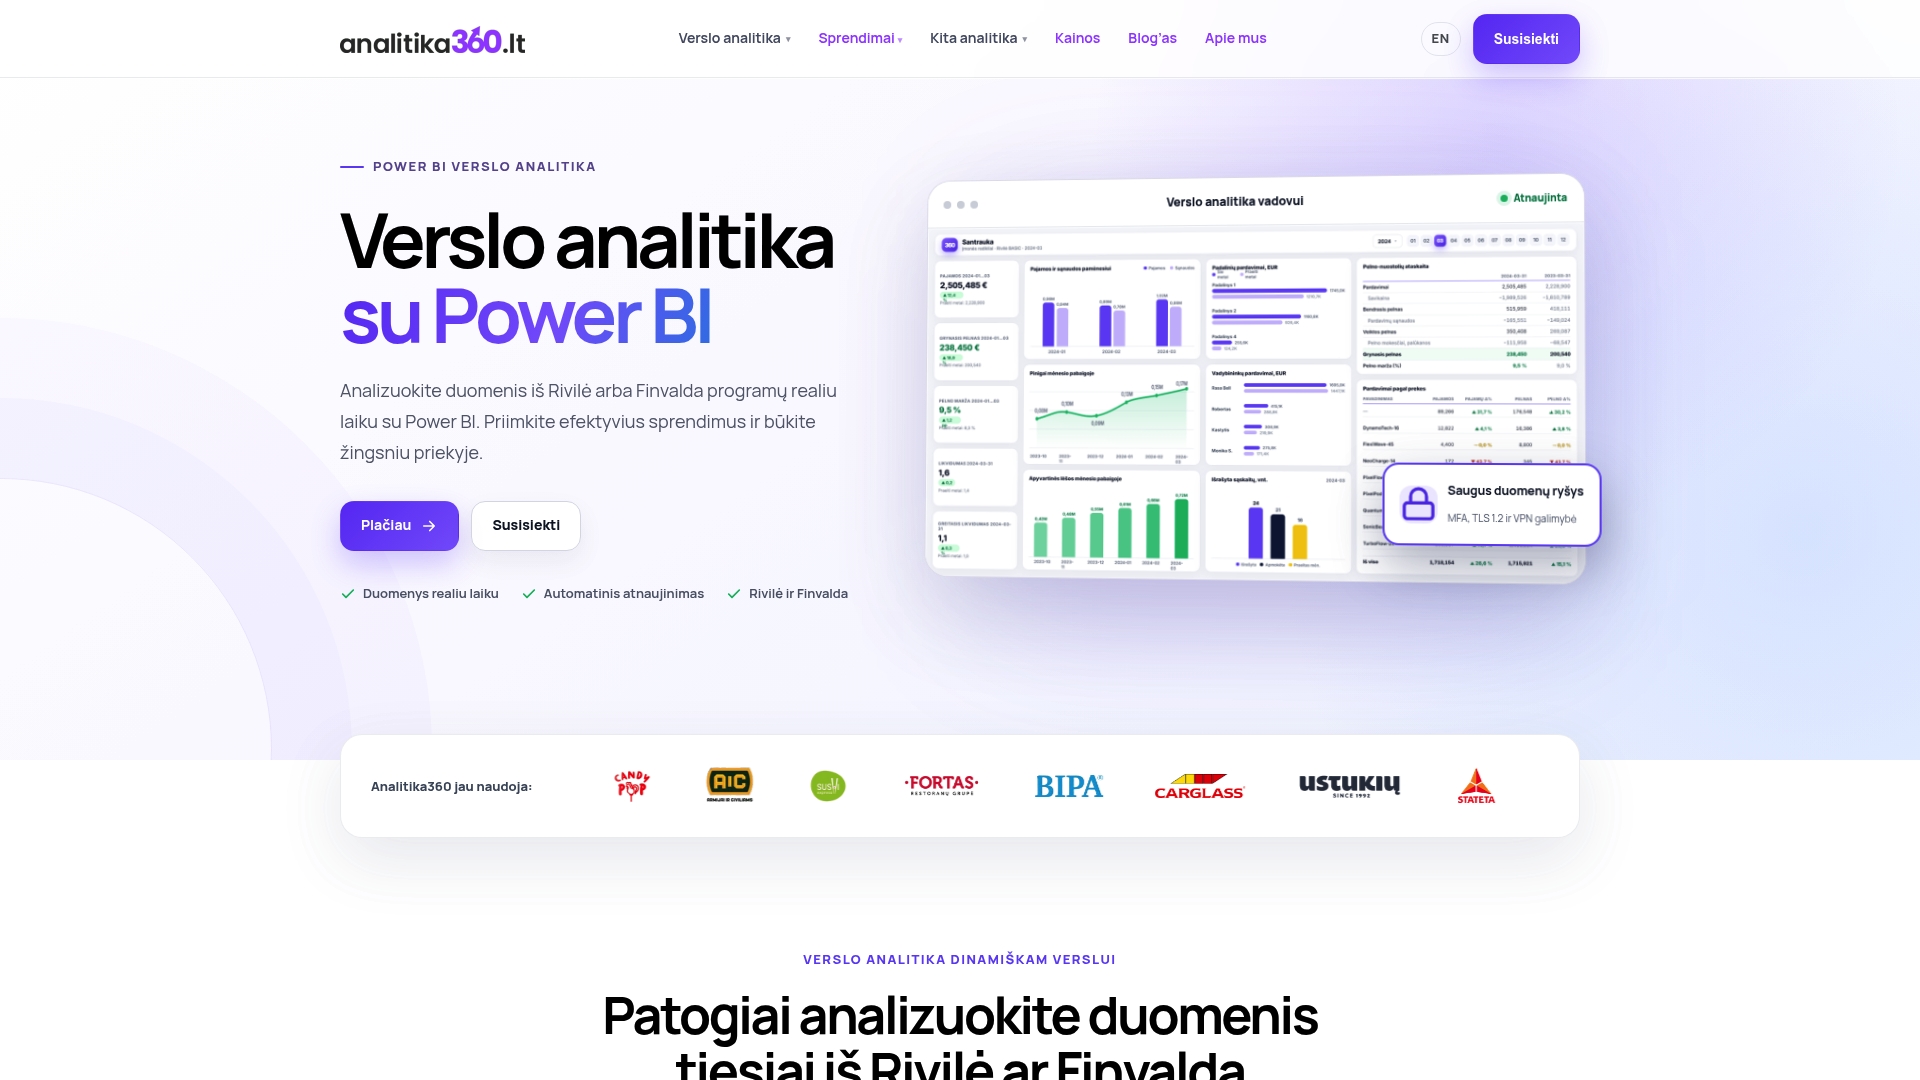
Rivilė data replication means that accounting data (invoice lines, general ledger entries, inventory balances, payments) is copied regularly from the accounting software to a location set aside for analytics. There it is combined with other sources and turned into reports. The copy of the data creates no value on its own. The value comes when you can see revenue, costs and profit without manually exporting to Excel. That is why, for most companies, the quickest route is not to build the API connections, staging database and refresh schedule themselves, but to choose a Power BI report package built for Rivilė or Finvalda users, in which the data refreshes automatically. The Analitika360 Basic package costs €59 a month.
In brief
- Replication means regularly moving accounting data into an analytics model so that reports refresh without anyone having to step in.
- Rivile ERP provides its analytics data through a single REST endpoint: sales and purchase invoice lines, balances, the general ledger, payments, customers, products and prices.
- Doing it yourself requires an access token, filtered queries, a staging database for larger volumes, a refresh schedule and data reconciliation.
- Rivile ERP keeps the result of an identical query in a cache for 8 hours, which needs to be taken into account when planning refreshes.
- Ready-made Power BI packages for Rivilė and Finvalda users take over these steps: the data refreshes automatically and the sources are combined into a single model.
Contents
- What replication means for accounting data
- Which Rivilė data can be transferred
- Finvalda: the same principle
- Replication step by step
- Refresh frequency and caching
- Data security and the impact on the accounting system
- Our view
- Ready-made Power BI packages for Rivilė and Finvalda users
- FAQ
- Sources
What replication means for accounting data
Accounting software is designed for recording documents, not for analysis. When you need to compare margins across several restaurants, see overdue debts by customer or track stock turnover, the data has to be extracted and processed elsewhere. Replication turns this work into an ongoing process: data flows regularly into the analytics model, and reports draw on its latest version.
It gives each reader something different:
- The owner of a restaurant chain sees each location’s revenue and costs every day, without waiting for the month-end close.
- The accountant no longer produces the same Excel export every week and presents the data visually.
- The finance director gets a single view of profit, the balance sheet and cash flow, even if some of the data sits in SharePoint or CRM systems.
- The consultant builds reports for several clients to the same structure.
- The small business owner keeps an eye on revenue figures on their phone, in near real time.
Which Rivilė data can be transferred
According to the Rivile ERP analytics guide, the data sources intended for analytics are available through a single endpoint: GET https://api.rivile.cloud/bi/collect. The most commonly used sources are:
| Data source | What it contains | Suitable reports |
|---|---|---|
| SALES_INVOICE_DETAILED | Sales invoice lines | Sales, margin, product and customer analysis |
| PURCHASE_INVOICE_DETAILED | Purchase invoice lines | Costs, suppliers, cost of sales |
| INVENTORY_STOCK | Inventory balances | Stock value, turnover |
| PAYABLE_RECEIVABLES_FLAT | Payables and receivables | Debts, overdue amounts |
| GENERAL_LEDGER | General ledger entries | Profit and loss statement, balance sheet |
| PAYMENTS | Payments | Cash flow |
| CLIENT, CLIENT_GROUP | Customers and customer groups | Segmentation, customer profitability |
| PRODUCT, PRICE | Products and pricing | Price and product range analysis |
Specific reports are built from these sources: Rivilė sales analysis, warehouse reports, debt control and balance sheet analysis. The point is not to transfer everything, but to transfer what your decisions need.
Finvalda: the same principle
For Finvalda users the logic is the same: data travels from the accounting software through an application programming interface (API) into a Power BI model, and reports refresh on a schedule. The technical side of the connection differs, so we cover it in more detail in the article Finvalda API and Power BI. Finvalda users’ most common needs are the same as Rivilė users’: a profit and loss statement, sales analysis and warehouse reports.
Replication step by step
Below is the whole process: what needs doing and where mistakes are most often made.
1. Define the reports you need
Start with the questions the report has to answer: what each division’s profit is, who is paying late, which products are sitting in the warehouse. A common mistake is to transfer every table “just in case” and then drown in data. In the ready-made Analitika360 packages the metrics (revenue, costs, profit, balance sheet, sales, warehouse, debts) are already defined, so this stage is reduced to discussing your specific requirements.
2. Obtain access
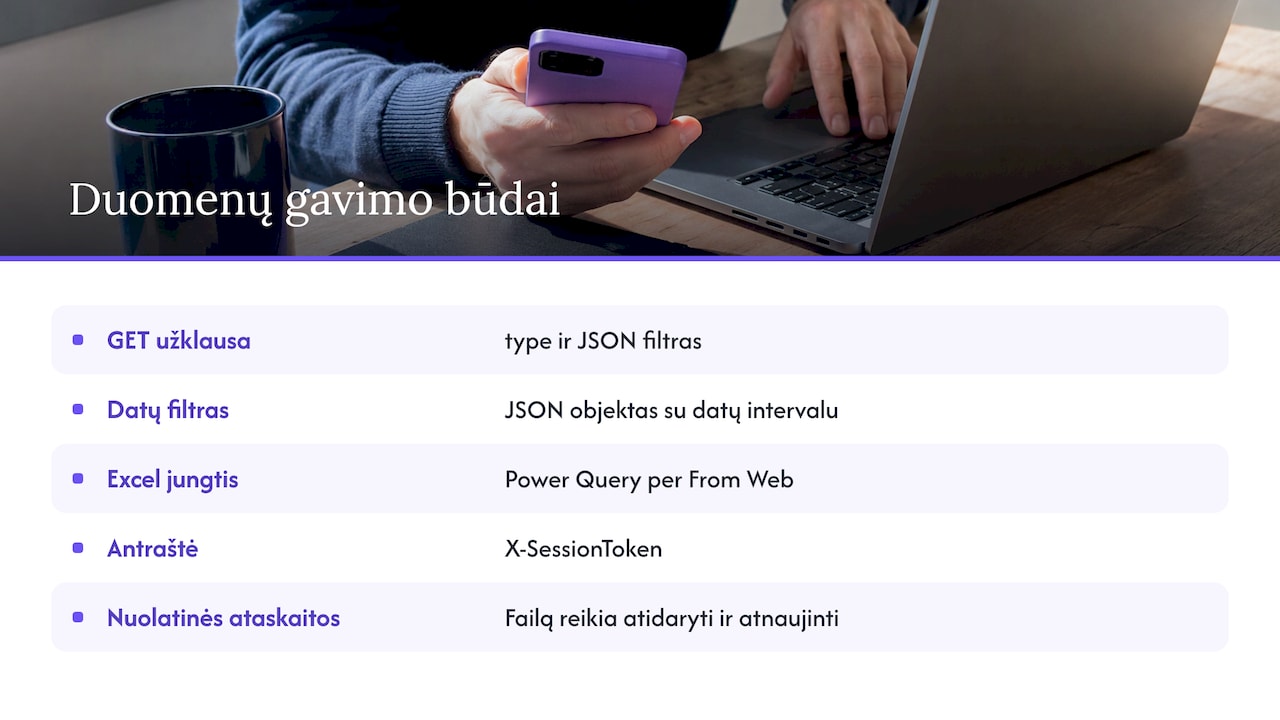
Rivile ERP requests are sent with a session token in the X-SessionToken header. Access should be set up by a responsible person, and the token should not be sent by email or stored in shared files.
3. Get to know the data structure
The Rivile ERP guide suggests first calling GET /bi/schemas/{dataSource}. This tells you which fields the chosen source contains. Skip this step and you will later find that the division, project or VAT field is missing, and the model has to be rebuilt.
4. Pull data with filters
Data is pulled with the request GET /bi/collect?type={dataSource}&filter={urlEncodedJson}, where the filter is a JSON object, for example with a date range. For Excel users the guide also describes connecting through Power Query: Data > Get Data > From Other Sources > From Web, specifying the REST endpoint, the X-SessionToken header and parameterised date filters. This approach works for one-off analysis. For ongoing reporting it is usually not enough: someone has to open the file and refresh it. We explain how to combine Excel and Power BI properly in the article Rivilė, Excel and Power BI.
5. Set up a staging data store
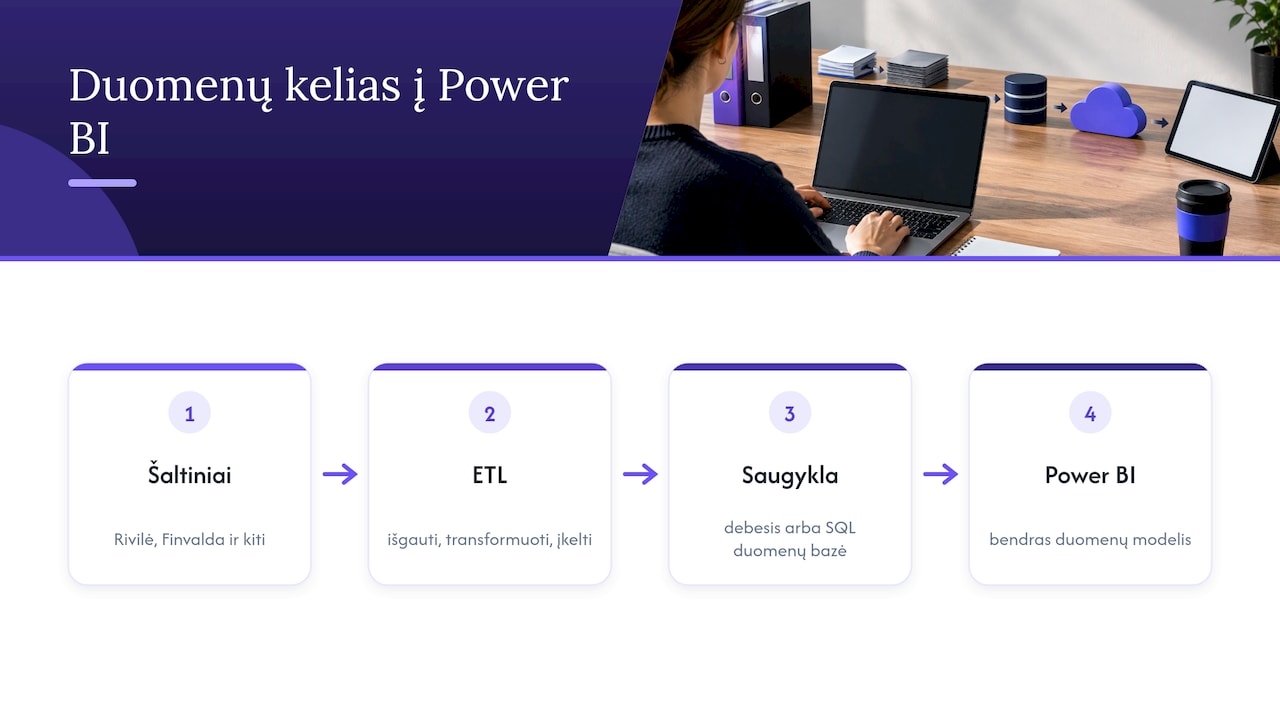
When there is a lot of data or the analytics tool has limited support for REST requests, the Rivile ERP guide recommends using an ETL tool (software for extracting, transforming and loading data) and loading the data into a cloud data warehouse or an SQL database. This is where most do-it-yourself projects get stuck: you need a server, maintenance and someone who understands both accounting and data engineering. Analitika360 integrates different sources (Rivilė or Finvalda, SharePoint, Excel, CRM, logistics systems) into a single Power BI model, so you do not need to build this infrastructure.
6. Schedule automatic refresh
Replication that has to be run by hand is just an export. Refreshes must happen on a schedule, without user involvement. This is precisely the main advantage of the Analitika360 packages: reports refresh automatically.
7. Reconcile and monitor
After every change, compare the report totals with the accounting software’s summaries, for example monthly sales and general ledger turnover. Discrepancies most often arise from credit notes being left out, an incorrect date filter or duplicates when joining tables.
Refresh frequency and caching
According to the Rivile ERP documentation, query results are held in a temporary cache for 8 hours. If you repeat the same query within that time, you will get the data from the cache rather than from the ERP database. In practice this means that repeating the same query frequently will not necessarily bring newer data, so the refresh schedule and the filters need to be aligned.
How often to refresh depends on the rhythm of your decisions:
- For restaurants and retail, daily sales and stock levels usually matter most.
- For the accounts team and finance managers, a daily refresh is often enough, with more frequent refreshes during the month-end close.
- For the board, what matters most is that the figures match the approved accounts. We cover this in more detail in the article board reports.
If a refresh fails, first check that the access token is still valid, the filter format, and whether the fields in the data source have changed.
Data security and the impact on the accounting system
Accounting data is sensitive: salaries, prices, customer debts. Reliable replication needs three things:
- Minimum permissions. Analytics access is read-only, so the reporting system cannot alter accounting entries.
- Role-based access. A restaurant manager sees their own location, a regional manager their region, the finance director everything. This is handled by row-level security in the Power BI model.
- A moderate load. When reports are based on the analytics model, each time a report is opened it does not send a new query to the accounting software, and the accountants’ work does not slow down.
In Analitika360 solutions, data security is part of the service, so these issues do not have to be tackled from scratch.
Our view
We see data replication not as an IT project but as a means to fast, well-founded business decisions. A company using Rivilė or Finvalda usually has no ambition to build its own data infrastructure. It needs to see revenue, costs and profit every day.
That is why, for Rivilė and Finvalda users, we build ready-made report sets in which the data refreshes without any extra work from the user. When more is needed, we connect SharePoint, Excel, CRM or logistics data to the same Power BI model. For restaurants, logistics and construction we have industry-specific reports.
If a company’s processes are non-standard, we tailor a bespoke solution to your processes and existing IT systems. That way replication stops being an ongoing headache and becomes a step forward.
Analitika360
Ready-made Power BI packages for Rivilė and Finvalda users
Rather than building the connections, staging database and refresh schedule yourself, you can start with a ready-made package. The accounting data and key metrics are already combined in it, and the reports refresh automatically.
| Package | Price |
|---|---|
| Rivilė Basic | €59 a month |
| Rivilė PRO | €89 a month |
| Finvalda Basic | €59 a month |
| Finvalda PRO | €89 a month |
| Bespoke projects | €70 an hour |
Compare the packages and choose the right one on the Analitika360 pricing page. You will also find Microsoft Pro and Premium licences there.
FAQ
Do I need my own server for replication?
Not necessarily. For small volumes, Rivile ERP lets you pull data directly through the REST interface, while for larger volumes a staging database is recommended. If you choose a ready-made Power BI package, you do not maintain a server yourself.
How does replication differ from an Excel export?
An export has to be done by someone by hand, and it quickly goes out of date. Replication runs on a schedule, and reports are based on the latest data with no extra work.
Can Rivilė data be combined with data from other systems?
Yes. Analitika360 integrates Rivilė or Finvalda data with SharePoint, Excel, CRM and logistics sources into a single Power BI model. We cover connecting a CRM in more detail in the article CRM and Power BI.
Why can’t I see an invoice I have just entered in the report?
Rivile ERP keeps the results of an identical query in a cache for 8 hours, and in addition the report refreshes on a set schedule. Check when the last refresh took place and whether the invoice falls within the filter’s date range.
Sources
Rivile ERP: for analytics, reporting and data export