Your business in 360°
 Subcontractor Reports in Power BI: How to Build a Solution That Works

The quickest sound route to subcontractor reporting in Power BI is a ready-built report package covering a general overview, a breakdown of purchases and costs, and hours metrics. We combine data from Rivilė or Finvalda with Excel and SharePoint sources. Once the model is built correctly, automated refresh removes the manual work and the metrics show the actual position in real time.
In brief:
- Build the report from overview, purchases and costs, and hours pages, and include cost trends, supplier concentration risk and filters by project and period.
- For medium-sized data, choose import mode and refresh several times a day; near-real-time modes can slow queries and temporarily show discrepancies.
- Apply row-level security and role-based access to sensitive pricing and contract data, and separate divisions into workspaces by legal entity or project.
- Use drilldown within the same visual for hierarchies, and open a separate supplier or project card only on demand, so the initial load is not weighed down.
- Rivilė Basic and Finvalda Basic cost around €59 a month, the PRO packages around €89 a month, and bespoke customisation is €70 an hour.
Contents
- Recommended report structure and essential KPIs for a subcontractor report
- Semantic model and performance choices: DirectQuery, import, composite model
- Interactivity: drilldown, drillthrough, paginated reports and actions from Power BI
- Security and access management in reports
- Automation, refreshes and operations
- How the Analitika360 solution simplifies rolling out subcontractor reports
- Get started quickly with our subcontractor report packages
- FAQ
- Sources
Recommended report structure and essential KPIs for a subcontractor report
A working subcontractor report usually has three main pages which, taken together, give the full picture, from the overall trend down to an individual transaction. The overview page shows high-level metrics: total costs, how they trend over the period, and supplier risk where a single subcontractor accounts for too large a share of spending.
The purchases and costs page breaks the data down by supplier, category and period. The purchase spend analysis content shows spending by supplier, product and period, allowing you to review both aggregated and transaction-level information. In other words, a user can see a supplier’s total invoiced amount and go straight to the specific transaction that affected it.
The hours and productivity page compares actual and budgeted hours, rates and project delivery metrics. The practice manager Power BI content comprises five pages: overview, cost, revenue, earned value management (EVM) metrics and an hours summary that can be filtered by a range of dimensions.
For the report to be useful in day-to-day work, the filters must let users switch quickly between views:
- Legal entity, where the business runs several companies or divisions.
- Project or site, against which subcontractor costs are allocated.
- Supplier, allowing several subcontractors’ performance to be compared at once.
- Period, making it possible to follow monthly or quarterly trends.
For comparing project budgets with actual costs, a separate methodology is helpful, which we cover in our article on budget comparison in Power BI.
Semantic model and performance choices: DirectQuery, import, composite model
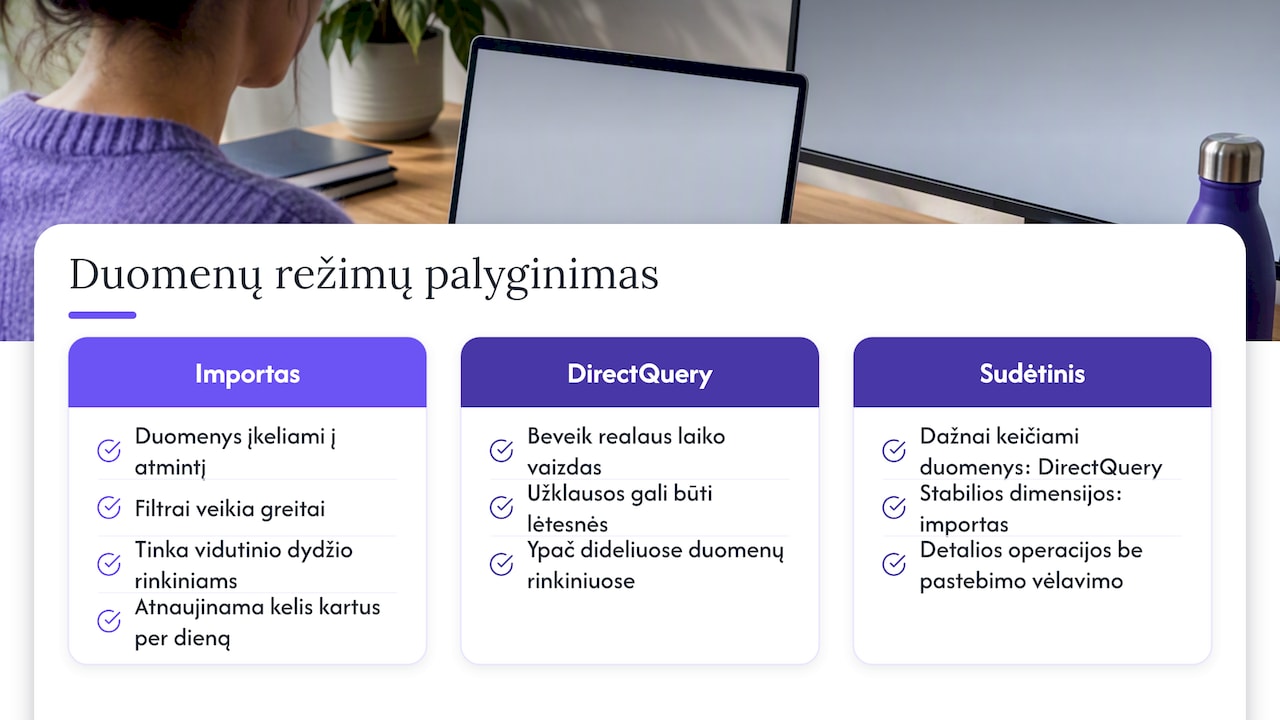
The choice of model mode has a direct effect on report speed and data freshness. Import mode loads the data into memory, so filters respond quickly, and it suits medium-sized subcontractor datasets where refreshing a few times a day is enough.
DirectQuery or DirectLake come into play when you need a near-real-time view, but the semantic model structure documentation notes that DirectLake mode can cause performance changes and temporary inconsistencies during refreshes. In practice this is a trade-off: the data looks fresher, but queries may run more slowly, particularly on larger datasets.
A composite model combines both approaches: frequently changing data is kept in DirectQuery mode, while the more stable dimensions (suppliers, projects, calendar) are imported. This arrangement also makes drillthrough scenarios easier, as users can move from a summary to a detailed transaction without noticeable delay. You will find a detailed comparison of the modes in our article on DirectQuery or import.
Interactivity: drilldown, drillthrough, paginated reports and actions from Power BI
How far users can dig into the data depends on which technique we choose for a given scenario. The documentation on drillthrough, drilldown and subreports states that subreports are processed together with the main report, whereas drillthrough reports are processed only when the user takes an action. This has a direct bearing on performance: subreports slow down the initial load, while drillthrough defers that burden.
- Drilldown suits moving through a hierarchy, for example from year to month and day.
- Drillthrough suits moving from a summary to a detailed card for an individual supplier or project.
- Paginated reports suit cases where you need a printable document with an exact list of transactions, such as an invoice register.
When users need not only to view data but also to add to it, the Power Apps visual is useful: the integration documentation states that the report must be published to the Power BI service, as the visual does not work in Power BI Report Server.
Pro tip: Start with drilldown on simple hierarchies and move to drillthrough only when the summary page starts to become overloaded.
Security and access management in reports
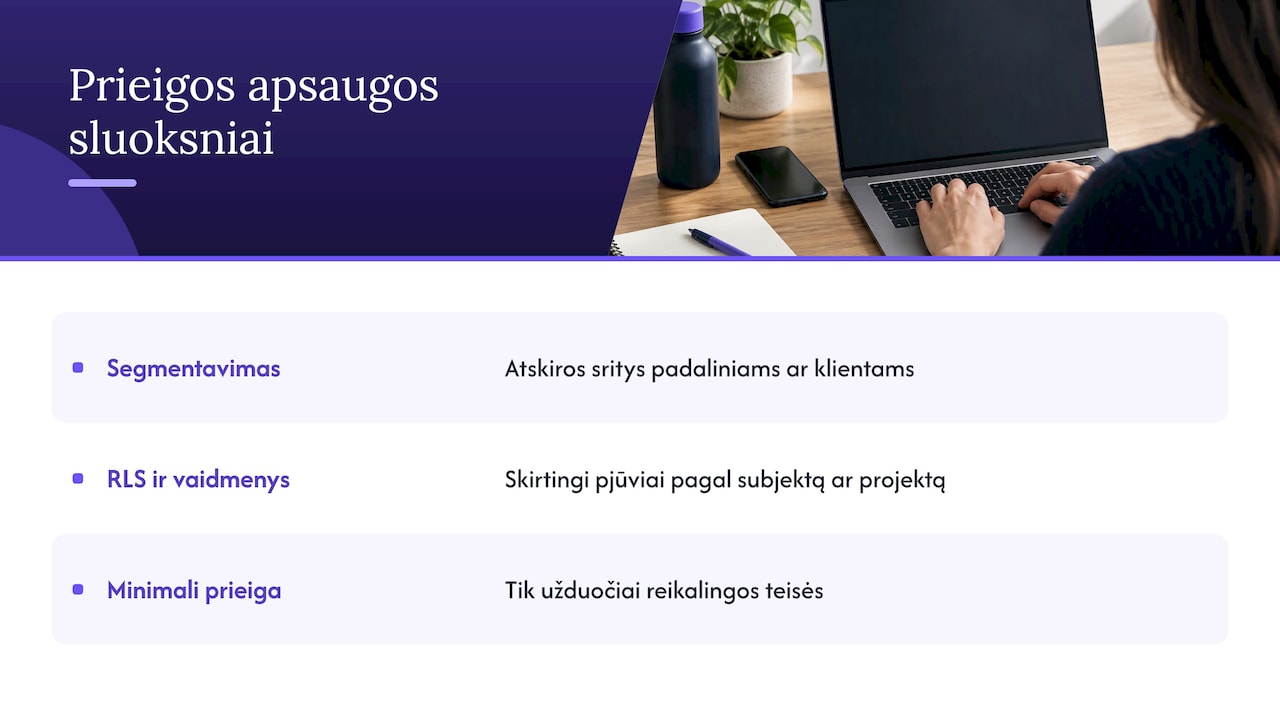
Subcontractor data often includes sensitive pricing and contract information, so access control matters just as much as the model design itself. Guidance on segmentation strategy states that isolating workloads and separating responsibilities helps apply the principle of least privilege across the platform.
In practice this means two layers of protection. First, segmentation of environments and solutions: separate workspaces for different divisions or clients reduce the risk of one user seeing someone else’s data. Second, row-level security (RLS) combined with role-based access lets the same report be shown to different users with different slices of data by legal entity or project.
The principle of least privilege means that each user is given only as much access as their task requires, with additional rights granted separately and on justified grounds. We discuss local data protection aspects in our article on GDPR and Power BI.
Automation, refreshes and operations
Scheduled refreshes suit most subcontractor reports, as the data changes gradually over the day rather than every second. In DirectQuery or DirectLake scenarios the behaviour differs: the data is shown closer to real time, but, as mentioned earlier, this can come at a cost in performance and briefly cause discrepancies between the source and the report.
For stable operation, continuous refresh monitoring with alerts when a refresh fails is worthwhile, so that the problem is spotted before a user sees out-of-date data. Version control and a clear workspace publishing process (test first, then production) guard against unexpected changes in the production report. We describe a similar approach for financial reports in our article on cash flow analysis.
How the Analitika360 solution simplifies rolling out subcontractor reports
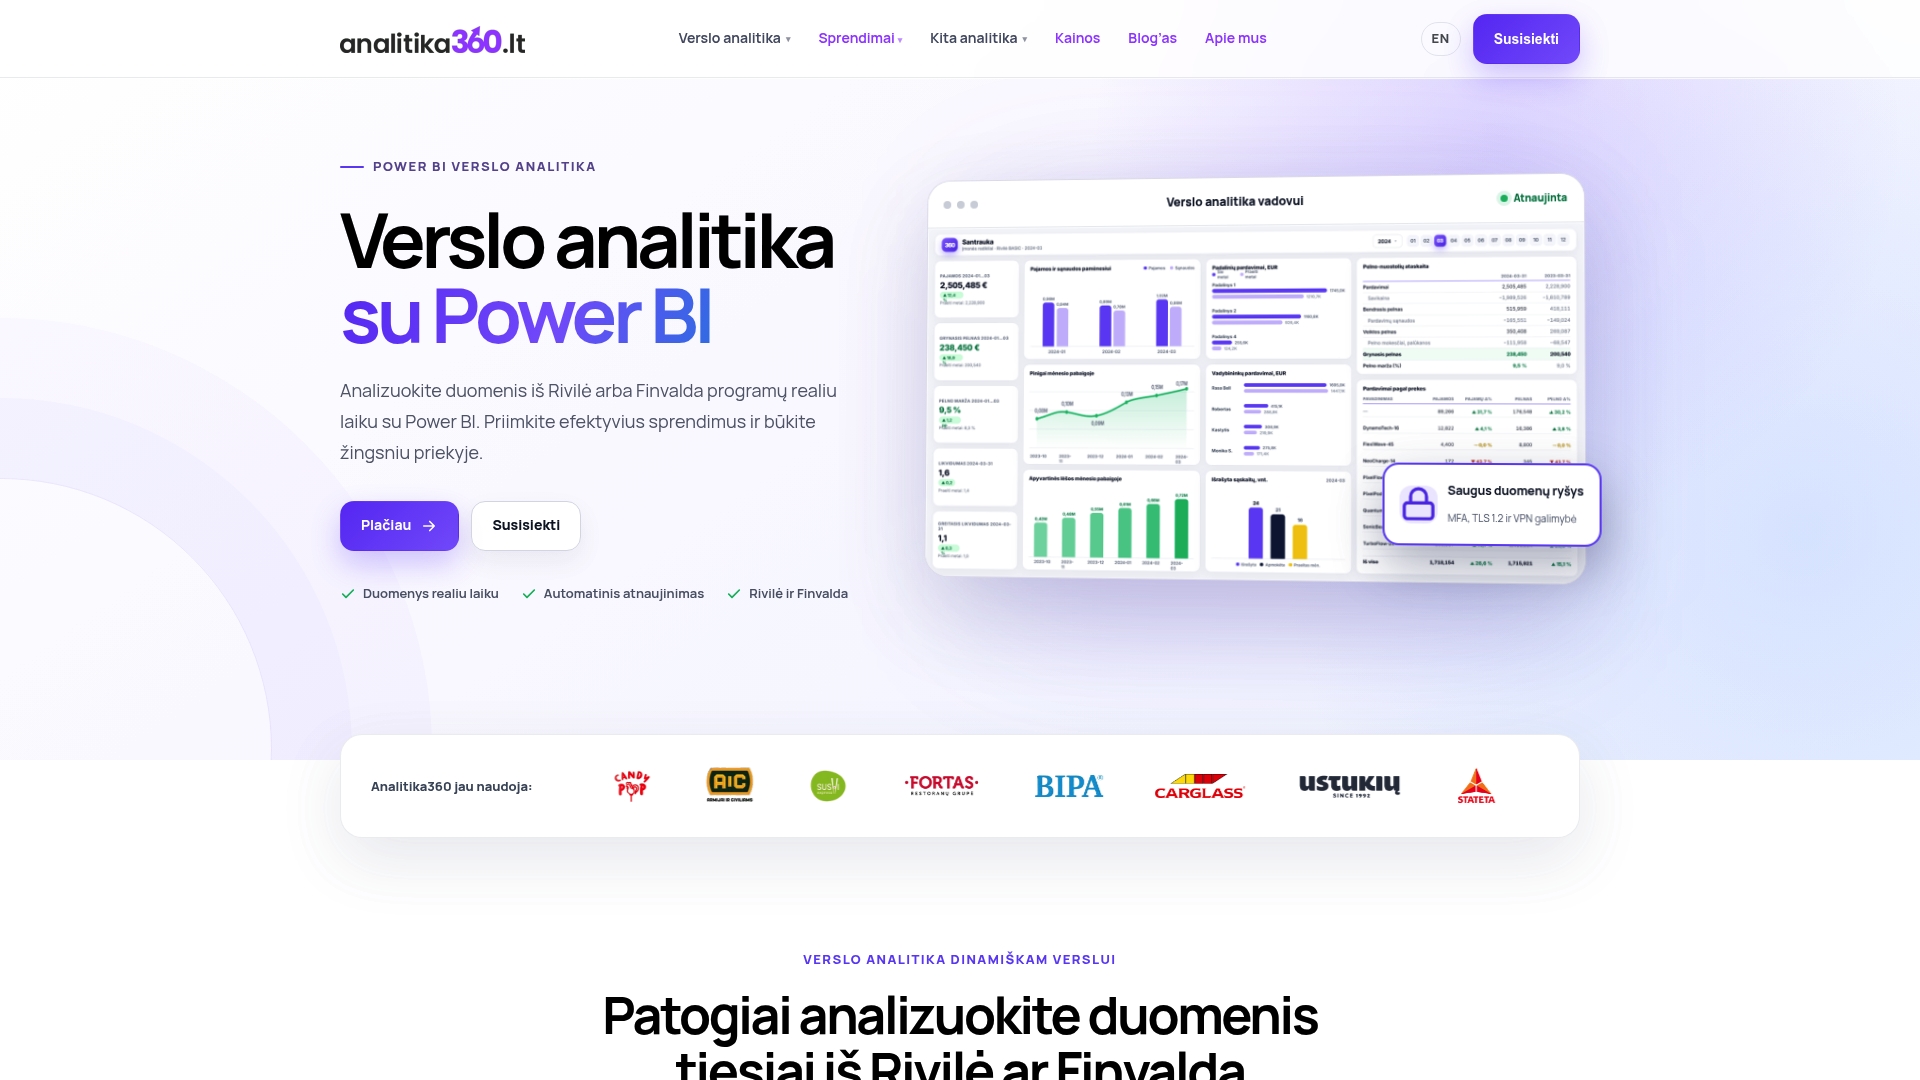
Ready-built report packages let you skip the lengthy model design stage and start from a structure that already works. Automatic data refresh removes manual exports from the accounting system, and the metrics stay up to date without any further intervention from users.
Businesses operating several legal entities get a single consolidated view instead of separate reports for each company. This shortens the month-end close and reduces the likelihood of errors that creep in when data is moved manually between systems.
— Analitika360
Get started quickly with our subcontractor report packages
If you want to get started without a lengthy implementation stage, the Rivilė Basic or Finvalda Basic packages, at around €59 a month, provide a ready-built set of reports with automatic data refresh from your accounting system.
For more complex needs, where several data sources or customised calculations are required, we offer PRO packages or bespoke projects:
- PRO packages, designed for a broader range of metrics.
- Bespoke projects, where the model needs to be tailored to specific processes or additional systems.
- Microsoft Pro and Premium licences, where the organisation needs a wider Power BI infrastructure.
You will find a full comparison of prices and packages on our business analytics pricing page, where you can also get in touch to arrange a short demonstration of the solution.
FAQ
How long does it take to implement subcontractor reporting in Power BI?
Implementation time depends on the number of data sources and the complexity of the model, but a ready-built package with Rivilė or Finvalda integration lets you start working considerably sooner than building a model from scratch. Bespoke projects tailored to specific processes usually take longer because of the additional work aligning sources.
Is Power BI suitable for a small subcontractor portfolio?
Yes, import mode works well for smaller datasets, as it delivers fast filters and does not require complex infrastructure. As data volumes grow or a need for real-time data arises, it is worth moving to a composite model with a DirectQuery element.
What is the difference between drilldown and drillthrough in subcontractor reports?
Drilldown lets you move through a hierarchy, for example from year to month, within the same visual, whereas drillthrough takes you to a separate page of detailed information for a specific supplier or project. The documentation on drillthrough and drilldown confirms that these techniques also differ in how they are processed, which affects report speed.
How can I make sure subcontractor data is visible only to the right users?
Row-level security combined with role-based access lets the same report be shown to different users with different slices of data by legal entity or project. In addition, it is worth applying environment segmentation, which isolates workloads in line with recommended security strategies.
How much does a Power BI subcontractor report package cost?
The Rivilė Basic and Finvalda Basic packages cost around €59 a month, while the PRO versions, which offer broader functionality, cost around €89 a month. Bespoke projects are charged at €70 an hour, depending on the scope of customisation required.
Sources
The quality of a subcontractor report depends on how carefully the data is prepared before it reaches the model. Rivilė and Finvalda are the main sources from which purchase and cost lines need to be extracted, while Excel and SharePoint usually supplement them with operational information that the accounting system does not record.
In practice, the ETL process follows several steps:
- Power BI content: Purchase spend analysis - Finance & Operations | Dynamics 365 | Microsoft Learn
This consistent preparation reduces the likelihood of errors and means the metrics can be trusted when they are used to make decisions. We cover the technical side of connecting CRM data to Power BI in our article on CRM and Power BI integration, and you will find the steps for installing a data gateway in our data gateway guide.