Your business in 360°
Data Catalogue in Power BI: How to Build and Use One

A data catalogue in Power BI is a single list showing which datasets (semantic models) a company has, where their data comes from, who is responsible for them, who can see them and when they were last refreshed. It does not replace reports. It helps staff find the right data and trust it. For a manager, it means that revenue, cost and profit figures match across every report, because they all come from the same documented source.
In brief
- The catalogue describes the data; the report displays it. The catalogue holds information about each dataset: owner, source, access rights, refresh frequency and quality.
- For small and medium-sized companies, the Power BI service’s built-in features are enough, together with clear rules. Large organisations with many systems use Microsoft Purview.
- For deciding which fields to document, you can draw on Lithuania’s DCAT-AP-LT standard: title, description, owner, access rights, provenance, frequency, modification date and quality.
- A catalogue only works if the data refreshes automatically. An out-of-date dataset in the catalogue is more misleading than having no catalogue at all.
- For Rivilė and Finvalda users, Analitika360’s ready-built report packages already come with a documented, unified data model you can start from.
Contents
- What a data catalogue is and how it differs from a report
- Where the catalogue lives in the Power BI ecosystem
- What to document in the catalogue
- How to build a catalogue: 6 steps
- Access rights, provenance, quality and refresh
- A catalogue for financial analysis: revenue, costs, profit
- Our view
- A ready-built model for Rivilė and Finvalda users
- Licences and additional costs
- FAQ
- Sources
What a data catalogue is and how it differs from a report
Three concepts are often confused in Power BI:
- A report is a set of visualisation pages: the charts, tables and indicators the user sees.
- A dataset (semantic model) is the tables, relationships and calculations (DAX measures) that one or more reports rely on.
- A data catalogue is a list of descriptions of all datasets and sources: what the data is, where it comes from, who maintains it and who it is intended for.
A simple example. A restaurant chain has a sales report, a cost report and a profit report. If each has its own separate dataset, built by different people, the ‘revenue’ figure may differ across the three reports. The catalogue answers the question: which dataset is the official one, who approved it and which accounting system it pulls its data from.
It is also worth distinguishing a data dictionary from a catalogue. A dictionary defines individual fields, for example what ‘gross profit’ means. A catalogue covers more: how datasets relate to one another, provenance, a glossary of business terms and search. In practice, a good Power BI catalogue contains both layers.
Where the catalogue lives in the Power BI ecosystem
Power BI has no single ‘create catalogue’ button. Catalogue functionality is made up of several parts, and it is important to know what each one does.
Power BI Desktop
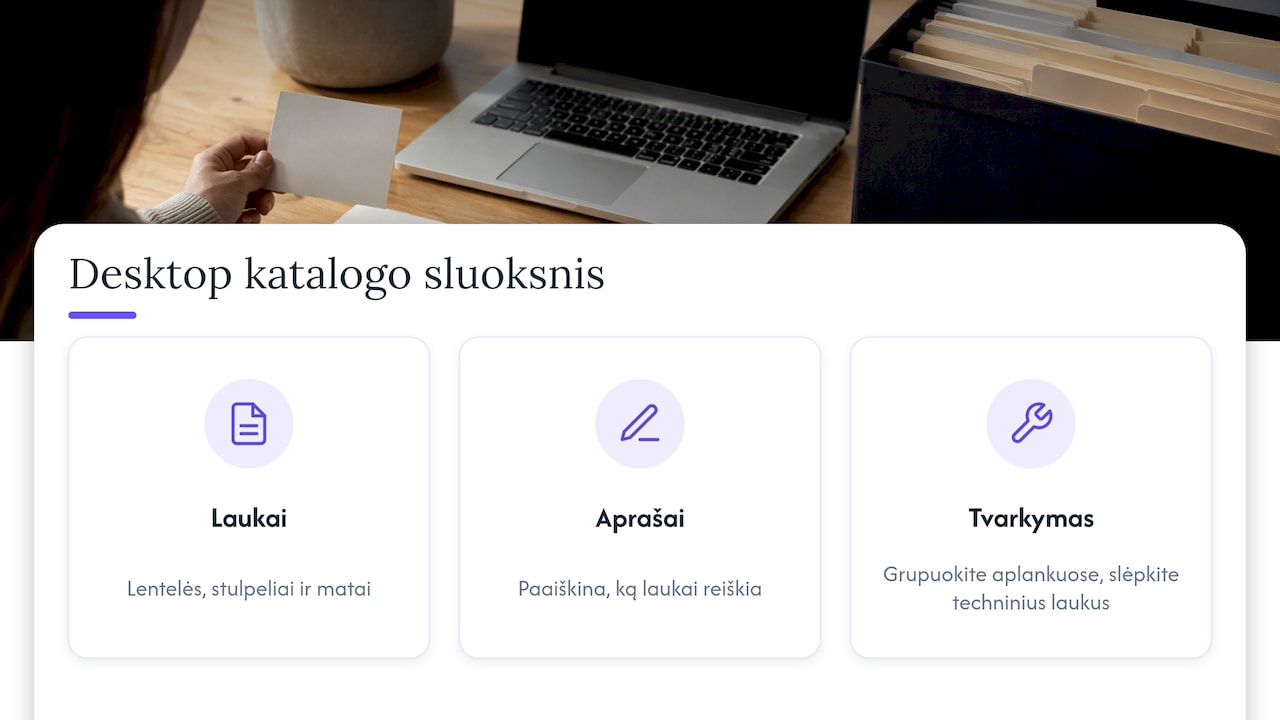
This is where the data model is built. In Desktop you can describe tables, columns and measures, group them into folders and hide technical fields. This is the first layer of the catalogue: if fields in the model are clearly named and have descriptions, users in the service will find it easier to understand what they mean.
Power BI service
Once a model is published to the Power BI service, it can be found, marked as promoted or certified, its lineage can be viewed (which sources it draws data from and which reports use it), and access can be managed through workspaces. Before you start, it is worth reading a general overview of how these features make up a Power BI data catalogue. For most small and medium-sized companies, these features are sufficient.

Microsoft Purview
When a company has many systems (SQL databases, data warehouses, cloud services) and wants a single governance centre for all its data, it uses Microsoft Purview. An academic review of Purview’s architecture highlights that what sets it apart is its integration with Office 365 rights management: access to data can be managed consistently across both SQL databases and Power BI reports. This is an enterprise-level solution, worth considering when you have dozens of data sources.
What to document in the catalogue
In Lithuania, public sector datasets are described according to the DCAT-AP-LT metadata standard. It is designed for open data, but its list of fields works equally well for an internal Power BI catalogue. Below we show how to apply them in a business setting.
| Field | What to enter | Example |
|---|---|---|
| Title | Clear, in business language | ‘Sales by department’ |
| Description | What it shows, who it is for | Revenue excluding VAT by restaurant and day |
| Owner and contact | Responsible person | Head of finance |
| Keywords | For search | revenue, sales, restaurants |
| Access rights | Who can see the data | Management; department heads see only their own department |
| Provenance and source | Where the data comes from | Rivilė, plus an Excel plan from SharePoint |
| Refresh frequency | How often | Daily at 6:00 |
| Modification date | Last refresh | Shown automatically |
| Version | Model changes | v2: warehouse stock levels added |
| Quality description | Known limitations, checks | Reconciled with the general ledger monthly |
| Documentation | Link to the description | Measure calculation rules |
We also recommend documenting business terms. If ‘profit’ means gross profit to some people in the company and net profit to others, the catalogue must define it clearly.
How to build a catalogue: 6 steps
- List your sources. The accounting system (Rivilė or Finvalda), Excel files, SharePoint lists, CRM, logistics system. Name an owner for each.
- Combine the sources into a single model. The fewer separate datasets, the fewer conflicting figures. We explain how to do this with accounting and Excel data in our article on how to combine Rivilė, Excel and Power BI.
- Document the model in Desktop. Rename technical fields, add descriptions to measures and hide helper columns.
- Publish and mark the official dataset. In the service, mark the dataset as endorsed so that staff know which one to rely on.
- Set up access and refresh. On-premises sources will need a gateway, which we cover in more detail in our guide to the Power BI data gateway.
- Appoint a responsible person. A catalogue without someone to maintain it goes out of date within a few months.
Access rights, provenance, quality and refresh
Among the mandatory descriptions in the DCAT-AP-LT standard are access rights, provenance, accrual periodicity, modification date and quality measurement. These are exactly the areas where gaps most often appear in a Power BI catalogue.
- Access rights. Set up roles in workspaces and, where needed, row-level security (RLS) so that a department head sees only their own department’s data. We describe a set of rules in our article on Power BI governance and roles.
- Lineage tracking. The lineage view in the service shows the path from source to report. If the structure of an Excel file changes, you will see straight away which reports are affected.
- Quality. Build in checks: does total revenue match the general ledger, are there any blank department codes? You will find a practical checklist in our data quality monitoring guide.
- Refresh. The frequency stated in the catalogue must match the actual schedule. We have written about how to set it up and what the limitations are in our article on scheduled refresh.
- Usage monitoring. You can see who opened a report and when in the Power BI audit logs. This helps clear unused datasets out of the catalogue.
A catalogue for financial analysis: revenue, costs, profit
For a finance director, a catalogue above all means a single source of truth. When revenue, cost and profit figures are calculated in one documented model, nobody at the management meeting argues any longer about whose Excel file is correct.
A typical structure for a company using Rivilė or Finvalda:
- Finance model: revenue, costs, profit and the balance sheet, combined with the budget from Excel or SharePoint.
- Sales model: sales by customer, product and sales manager.
- Inventory model: stock levels and turnover.
- Debt model: receivables and payables.
Each model has an owner and a description in the catalogue. The accountant knows where a figure comes from, and the manager can trust that the profit and loss statement shows the same as the accounting system. We explain how to prepare and read such a report in our article on the Finvalda profit and loss statement.
Our view
Many companies start building a catalogue by choosing a tool. Our experience shows that you need to start with the data model. If revenue, costs and profit are calculated in one well-organised Power BI model, the catalogue becomes simple: you only need to describe a few clear datasets rather than dozens of random files.
That is why we offer Rivilė and Finvalda users ready-built report sets with a unified model. The data refreshes automatically, with no extra work for the user, so the refresh date shown in the catalogue always reflects reality. We also integrate other sources into the same model: SharePoint, Excel, CRM or logistics systems.
Where a company’s processes are specific, we build a bespoke solution tailored to its existing IT systems. That way the catalogue reflects the real business rather than a theoretical diagram.
Analitika360
A ready-built model for Rivilė and Finvalda users
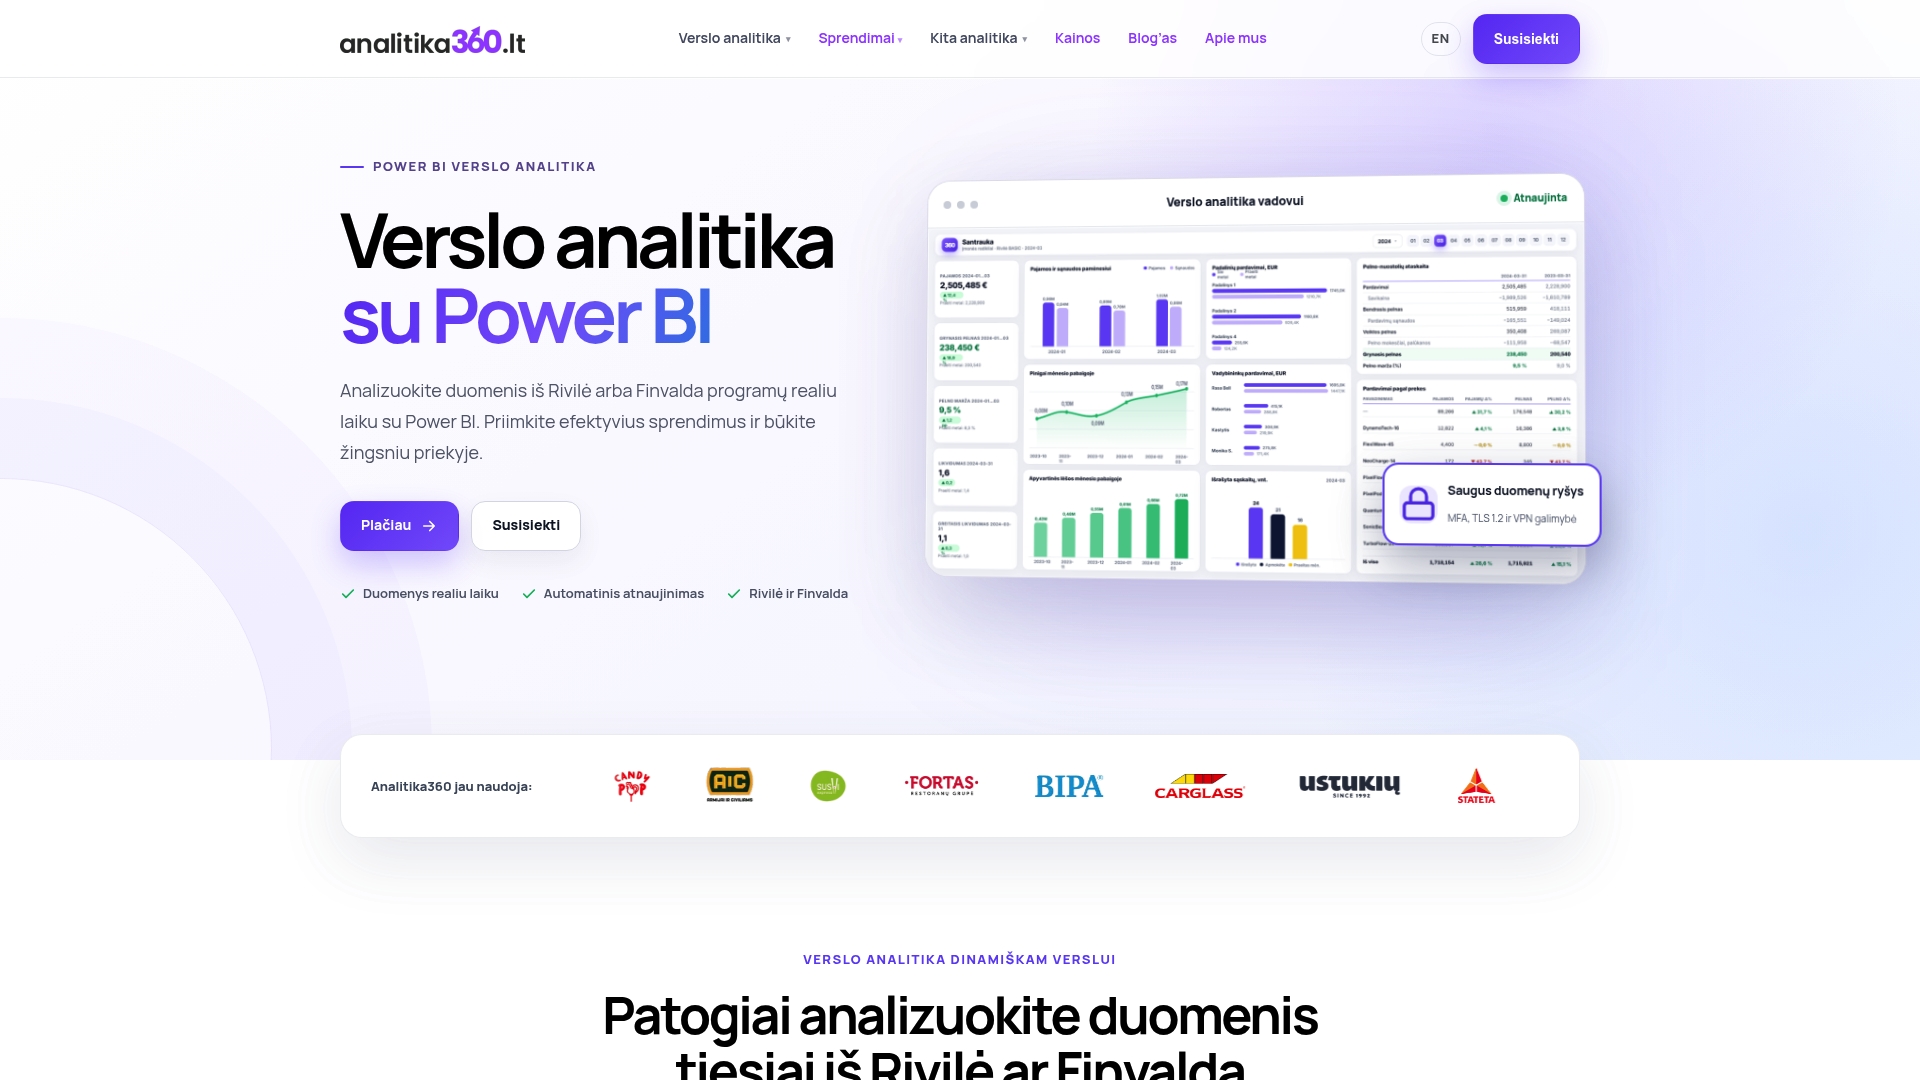
If your company uses Rivilė or Finvalda, there is no need to build a data model from scratch. Analitika360’s Power BI packages cover revenue, costs, profit, balance sheet, sales, inventory and debt metrics, all of which refresh automatically.
- Rivilė Basic and Finvalda Basic: €59 a month.
- Rivilė PRO and Finvalda PRO: €89 a month.
- Bespoke projects: €70 an hour.
You can compare and choose plans on the business analytics pricing page, and find out more about the packages in our overview reports without manual work.
Licences and additional costs
The cost of a catalogue depends on how many people use the reports and how extensively you want to govern your data.
- Power BI licences. To share reports and datasets in the Power BI service, users need the appropriate Microsoft licences (Pro or Premium). Analitika360 resells Microsoft Pro and Premium licences, so they can be purchased together with a report package. Check current Microsoft prices on the official Microsoft website, as they change.
- Sharing method. The number of licences you need depends on the sharing method you choose. We discuss the options in our article on sharing data in Power BI.
- Purview. This is a separate Microsoft service with its own pricing. It is relevant for companies managing many data systems.
- Data warehouse. As the number of sources grows, you may need an intermediate data store. We explain when one is needed in our article on the Power BI data warehouse.
FAQ
Does Power BI have a built-in data catalogue?
There is no separate product by that name, but the Power BI service lets you find datasets, mark them as endorsed, view their lineage and manage access. Together with a documented model in Desktop, this makes up the catalogue. For larger organisations, Microsoft Purview extends these capabilities.
Does a small company need Microsoft Purview?
Usually not. If your data comes from an accounting system, a few Excel files and SharePoint, the Power BI service’s features and clear rules are enough. Purview is worth considering when you have a very large number of sources and data systems.
How long does it take to build a catalogue?
It depends on the number of sources and the state of the model. If you use a ready-built Rivilė or Finvalda report package, most of the model is already documented, so all that remains is to add your own sources and access rules.
How does a data catalogue differ from the state data catalogue?
The public state data catalogue describes open public sector datasets. A company’s Power BI catalogue describes internal business data. Both can use the same DCAT-AP-LT metadata fields.
Sources
DCAT-AP-LT – Version 2 Microsoft Purview: A System for Central Governance of Data (VLDB) Power BI Data Catalog – Features, Benefits, How to Create?